
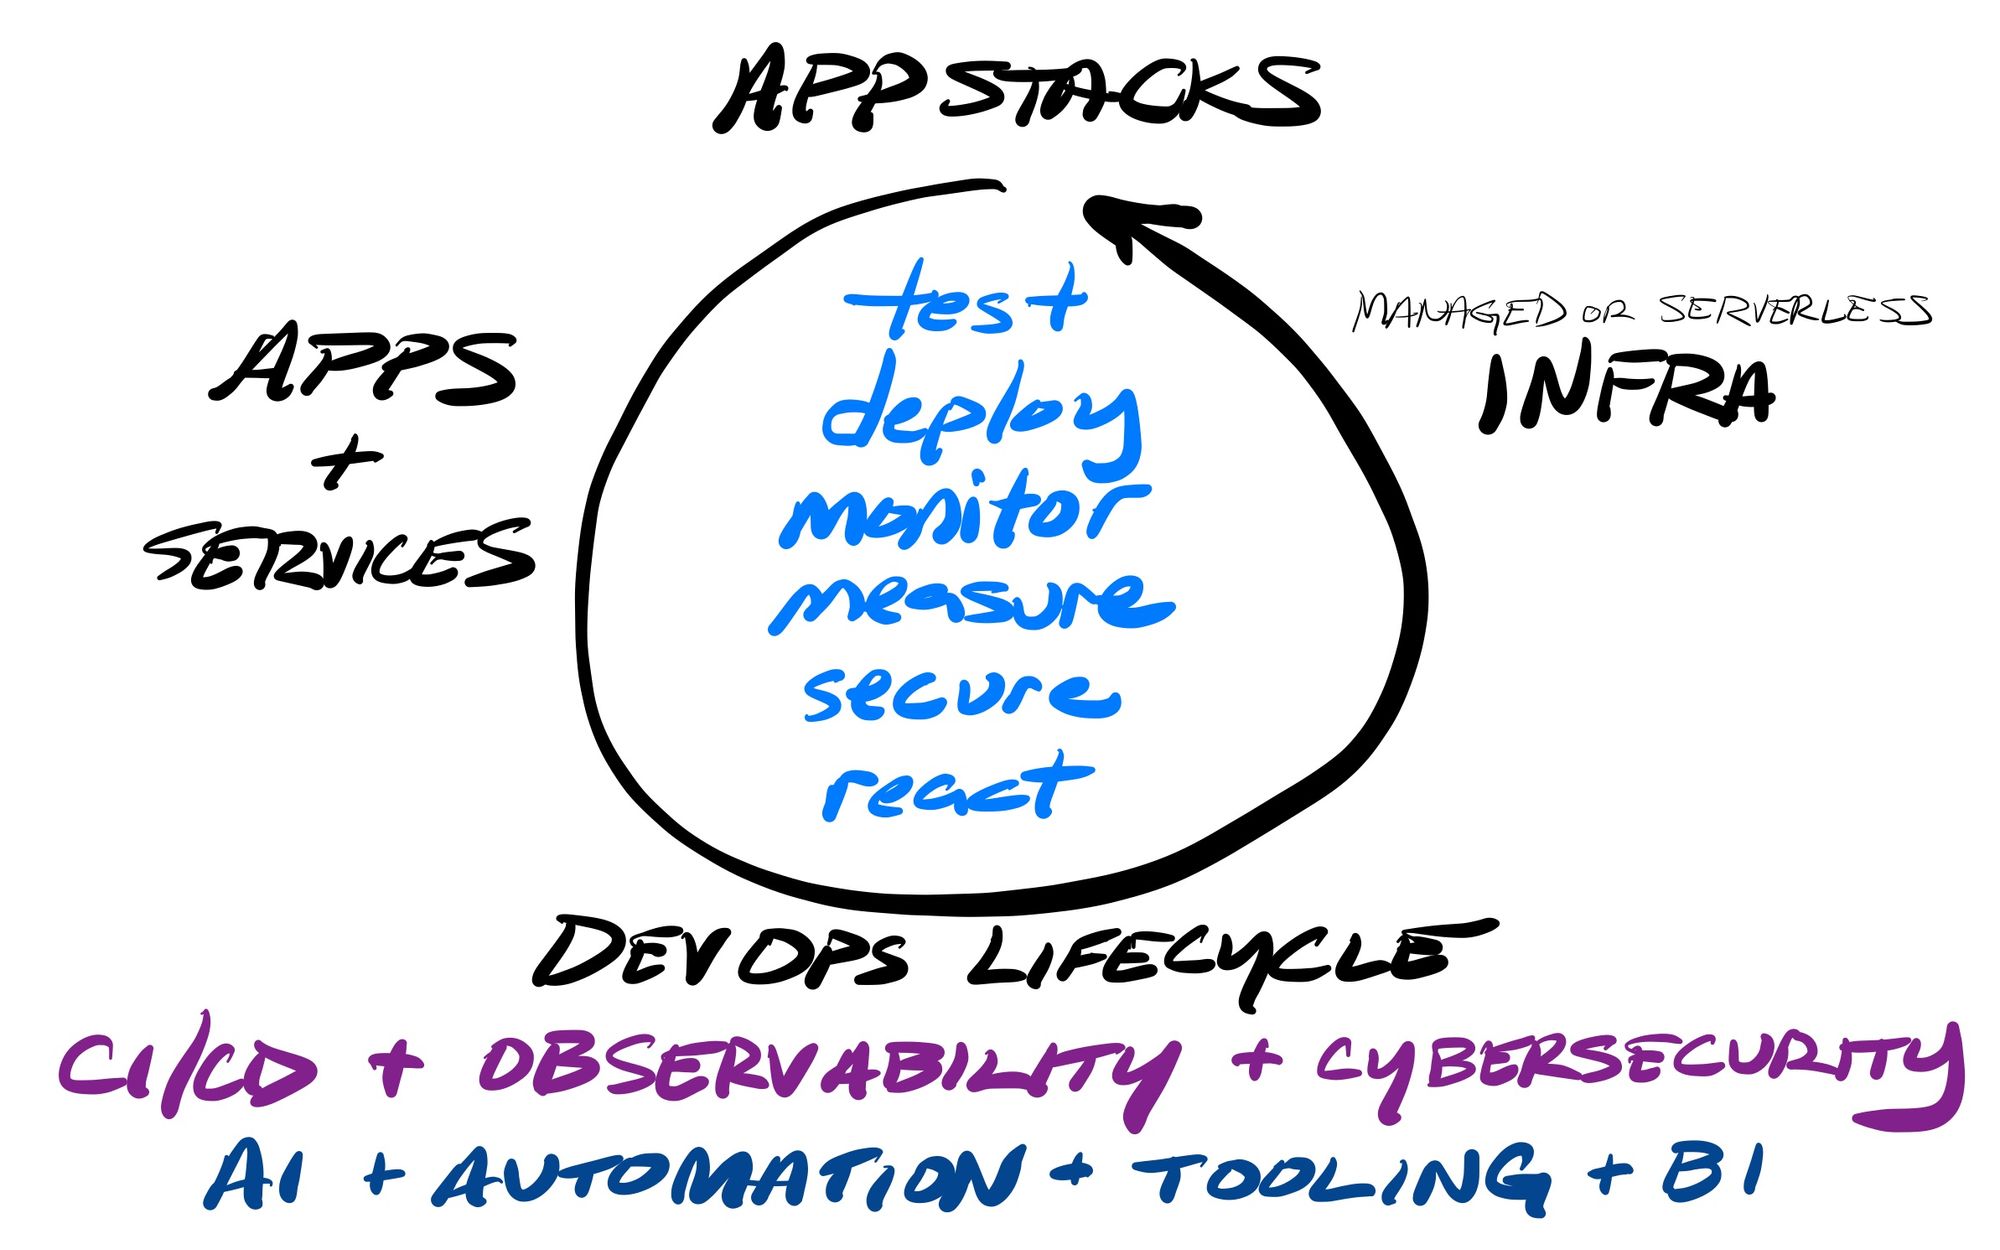
Today's applications are no longer just monolithic applications housed in tightly monitored and secured on-premise data centers. Not only is the application itself programmable, but the application stack that runs it, and the underlying infrastructure it all lies upon, are all now entirely programmable.
It is the age of automation of application stacks.... of distributed application architectures that use SOA and microservices... of distributed infrastructure that lies on-prem, in the cloud, or across clouds, that must shrink or grow as needed... or of no infrastructure at all, as cloud workloads move more and more into serverless environments. Customers need better tooling to manage multiple development stages (dev, test, staging, production), across any environment or cloud. Deployments could be centralized on one cloud, or scattered globally across many, and now even into edge networks. It is now a land grab for DevOps tooling, between developer pipeline tools, observability platforms, application cybersecurity, and incident management platforms.
Datadog can help its customers adapt through it all, as they migrate to the cloud and better hone their application stacks to natively leverage the cloud's capabilities. I've been enamored with them since their IPO in Dec-19, and it has remained a top holding of mine since – with a position fluctuating between 9-16%. However, since then, I haven't written on it much, so it's finally time to revisit what Datadog is providing, and how it can be an essential tool as companies migrate to cloud infrastructure and, most especially, cloud application workloads.
Datadog ticks off many boxes in what I look for in hypergrowth. It provides necessary tooling for development, and has been experiencing hypergrowth since IPOing. It is excelling at Land and Expand, as shown in its high customer growth and NRR consistently over 130%, with the number of enterprise customers growing +50% YoY, while having 75% of new customer lands being for multiple products. It has a customer-driven product roadmap that drives that expand, and demonstrates a fantastic release cadence from the product team. It is API-driven, providing the building blocks that allow DevOps workflows to be instrumented around its platform, and for deep integrations from partnering platforms.
[NOTE: This was originally written on July 15th, 2021, just before the latest Q221 earnings. I added a few updates in sections marked "LATER".]
A Pandemic Stumble
Datadog isn't charging for its platform based on the number of users – it is based on the amount of infrastructure used. Up until now, that has done nothing but rise, as more and more companies finally adopt the cloud and transition workloads over. However, in Q220, Datadog experienced a wide-spread belt tightening, as a huge number of enterprises initially panicked at the start of the pandemic in an effect to constrain its costs.
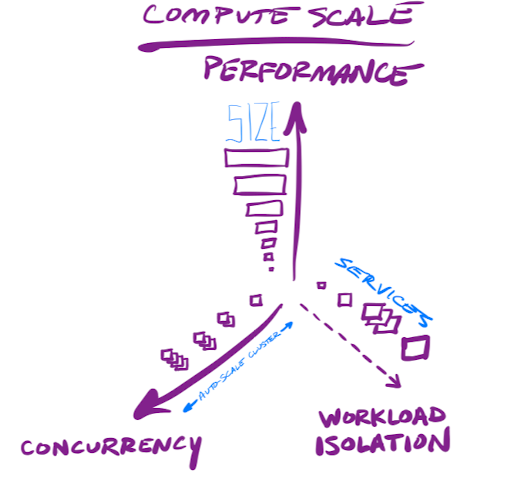
Every customer using cloud infrastructure can make choices about the level of performance and concurrency they want to support in their application stack. Dynamic cloud workloads can be adjusted based on the company's preference for concurrency and performance of their applications, such as controlling how many copies of a service is running under a load balancer. The underlying infrastructure can be resized, and compute and memory resources can be constrained by having the clusters serving up your microservices or containers shrunk or grown as needed. Computing resources can be restrained, as long as the company is okay with running batch jobs less frequently (daily instead of hourly), or having its applications slow down (increasing app response times, and giving its customers' longer wait times).
Since this pandemic-based panic, however, the cloud usage of app stacks has been back on the rise, and Datadog with it. They have been rebounding QoQ since Q220. CFO and FCF margins are now back to all time highs. I was hoping to see the sequential revenue gains stay near 15%, but even at the same +11.8% from Q1 reoccurring in Q2, that means this upcoming Q will see revenue grow +58.6% YoY as the belt-tightening quarter is lapped. I am personally hoping for a re-acceleration at or above 60% YoY. [LATER: Q221 came in at nearly 67%, accelerating to +17.6% sequentially! Next quarter should continue the re-acceleration to above 70%.]
| Q120 | Q220 | Q320 | Q420 | Q121 | Q221 | |
|---|---|---|---|---|---|---|
| Revenue YoY | +87.4% | +68.2% | +61.4% | +56.2% | +51.3% | +66.8% |
| Revenue QoQ | +15.5% | +6.7% | +10.5% | +14.8% | +11.8% | +17.6% |
| RPO | +82% | +53% | +50% | +78% | +81% | +103% |
| Cust Growth QoQ | +9.5% | +5.2% | +8.3% | +8.4% | +7.0% | +7.9% |
| Custs > 100K QoQ | +11.9% | +5.7% | +9.0% | +13.2% | +14.7% | +12.0% |
Products
Datadog's goal is to give a unified view into all aspects of modern infrastructure, application stacks, and applications themselves. But they have been expanding the scope of their platform over the past few years, in order to provide a more and more complete DevOps tool to monitor and manage application stacks.
They provide an Integration Network with over 450 plugins to tie to a wide variety of existing IaaS and SaaS services. With the Datadog platform, a company can see across systems, app, networks, and services, in order to get full visibility into every type of modern app stack. They can proactively test any part of their app stack, as well as monitor the overall user experience. The platform can help correlate all the layers of the stack together, allowing a user to drill into any tier, including the application code itself.
It allows customers to build custom dashboards and alerts over the entirety of their application stack, as well as ML analytical and business intelligence features to gain insights from all that collected data. Going further, it allows instrumenting your own DevOp processes directly into their API, deepening the stickiness.
They remain a vendor-neutral platform, that deeply integrates across the major cloud vendors for their IaaS and PaaS services of AWS, Azure, and GCP, and major SaaS services. They state the majority of their lands are greenfield. Regardless of where a customer lies on the journey into using cloud infrastructure and services, and into modern application strategies, Datadog can help.
Infrastructure focus
All modern infrastructure can be handled. They integrate heavily with the major application stack types, including containers and Kubernetes, with its watchful eye able to handle the dynamic nature as those environments grow and shrink.
DevSisters (Korean gaming company): "Even if we scale 10 times in 10 minutes, Datadog is able to handle it, and that’s immensely beneficial to us."
- Infrastructure Monitoring for complete observability over any stack, that can adjust to a dynamic environment.
- Log Management for processing, troubleshooting, and analytics across any app, device, or service utilized.
- Network Performance Monitoring (NPM) for full visibility into all networking between the components of your architecture – whether on-prem, cloud or hybrid, including legacy network appliances.
Deeper features include:
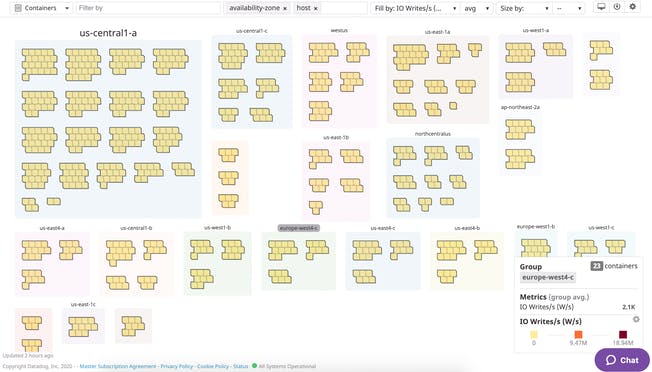
- Host Map creates a visual overview of all infrastructure across all environments, and Live Processes allows a direct, real-time dashboard into the processes running on each.
- Container Map creates a visual overview of all containers in use across all app stacks, and auto-groups them into usable clusters, and Live Containers allows a direct, real-time dashboard into each.
- Network Map creates a visual overview of all inter-networking between components of the app stack.
- Logging Without Limits allows for collecting & processing all logs through Datadog in a low-cost way, archiving and dynamically deciding which are most important. Log Rehydration extends this further, by allowing for archived logs to be pulled back into the platform (indexing them so they are again analyzable). This helps customers greatly control costs and how much of an active time window they want to keep in their observability platform, while being able to research any past incidents.
- With their API integration capabilities, Datadog makes it possible to tie the control of your application stack into the platform. While Kubernetes can auto-scale its containers based on what it directly sees (with compute, memory or network usage of the pod), with Datadog, DevOps teams can instrument their application stacks to scale Kubernetes using external factors, such as a custom KPI metrics (like unique page views or completed purchases) or even based upon infrastructure cost. This allows DevOps teams to tightly control the amount of infrastructure they run.
Application focus
If the application hasn't been instrumented with APM, perhaps the Log Management features above can provide enough vision. It includes a number of app logging features, as it can pull logs from a browser (web apps), Android/iOS devices (mobile apps), and a wide variety of dev languages (full stack or backend APIs). But with APM and other application features, all modern application architectures can be tracked, including distributed back-end applications, serverless functions, and widely dispersed front-end apps.
GlobalGiving (NPO): When we were migrating from our big monolith to a whole bunch of serverless functions, all of the data, metrics, and logs were diverse and all over the place. Datadog gives us the ability to view all of those metrics, logs, and traces from our serverless applications in one place.
- Application Performance Monitoring (APM) allows for end-to-end tracing across distributed applications, and pulling real-time statistics and custom metrics from application code.
- Serverless Monitoring allows for end-to-end tracing of distributed functions, and pulling real-time statistics and custom metrics from cloud-based serverless functions, and tracking serverless deployments.
- Synthetic Monitoring allows you to proactively monitor code deployment by continually running tests against browsers, APIs, and CI/CD tooling.
- Real User Monitoring (RUM) tracks the performance of an application from the perspective of its users across browsers (web apps) or Android/iOS devices (mobile apps), helping isolate areas of poor performance.
- Continuous Profiler hooks Datadog up to your application source code, so it can provide root cause analysis around errors and poor performance.
- [LATER: A new product, Database Monitoring was announced in Aug-21. It provides query performance tracking and profiling capabilities over database usage, which ties into both APM and Infrastructure Monitoring use cases. Think of this as a Continuous Profiler for Database Queries, providing a deeper historical view over query performance than the out-of-the-box integrations for data stores already provided (which are mostly around collecting performance & usage stats from the underlying database engine). For now, is limited to MySQL and PostgreSQL databases, but is sure to expand from here.]
Deeper features include:
- Runtime Metrics allows tying APM libraries into a wide variety of development languages, in order to pull real-time statistics from application engines and frameworks.
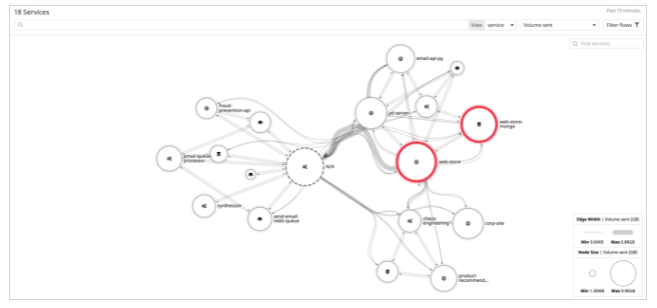
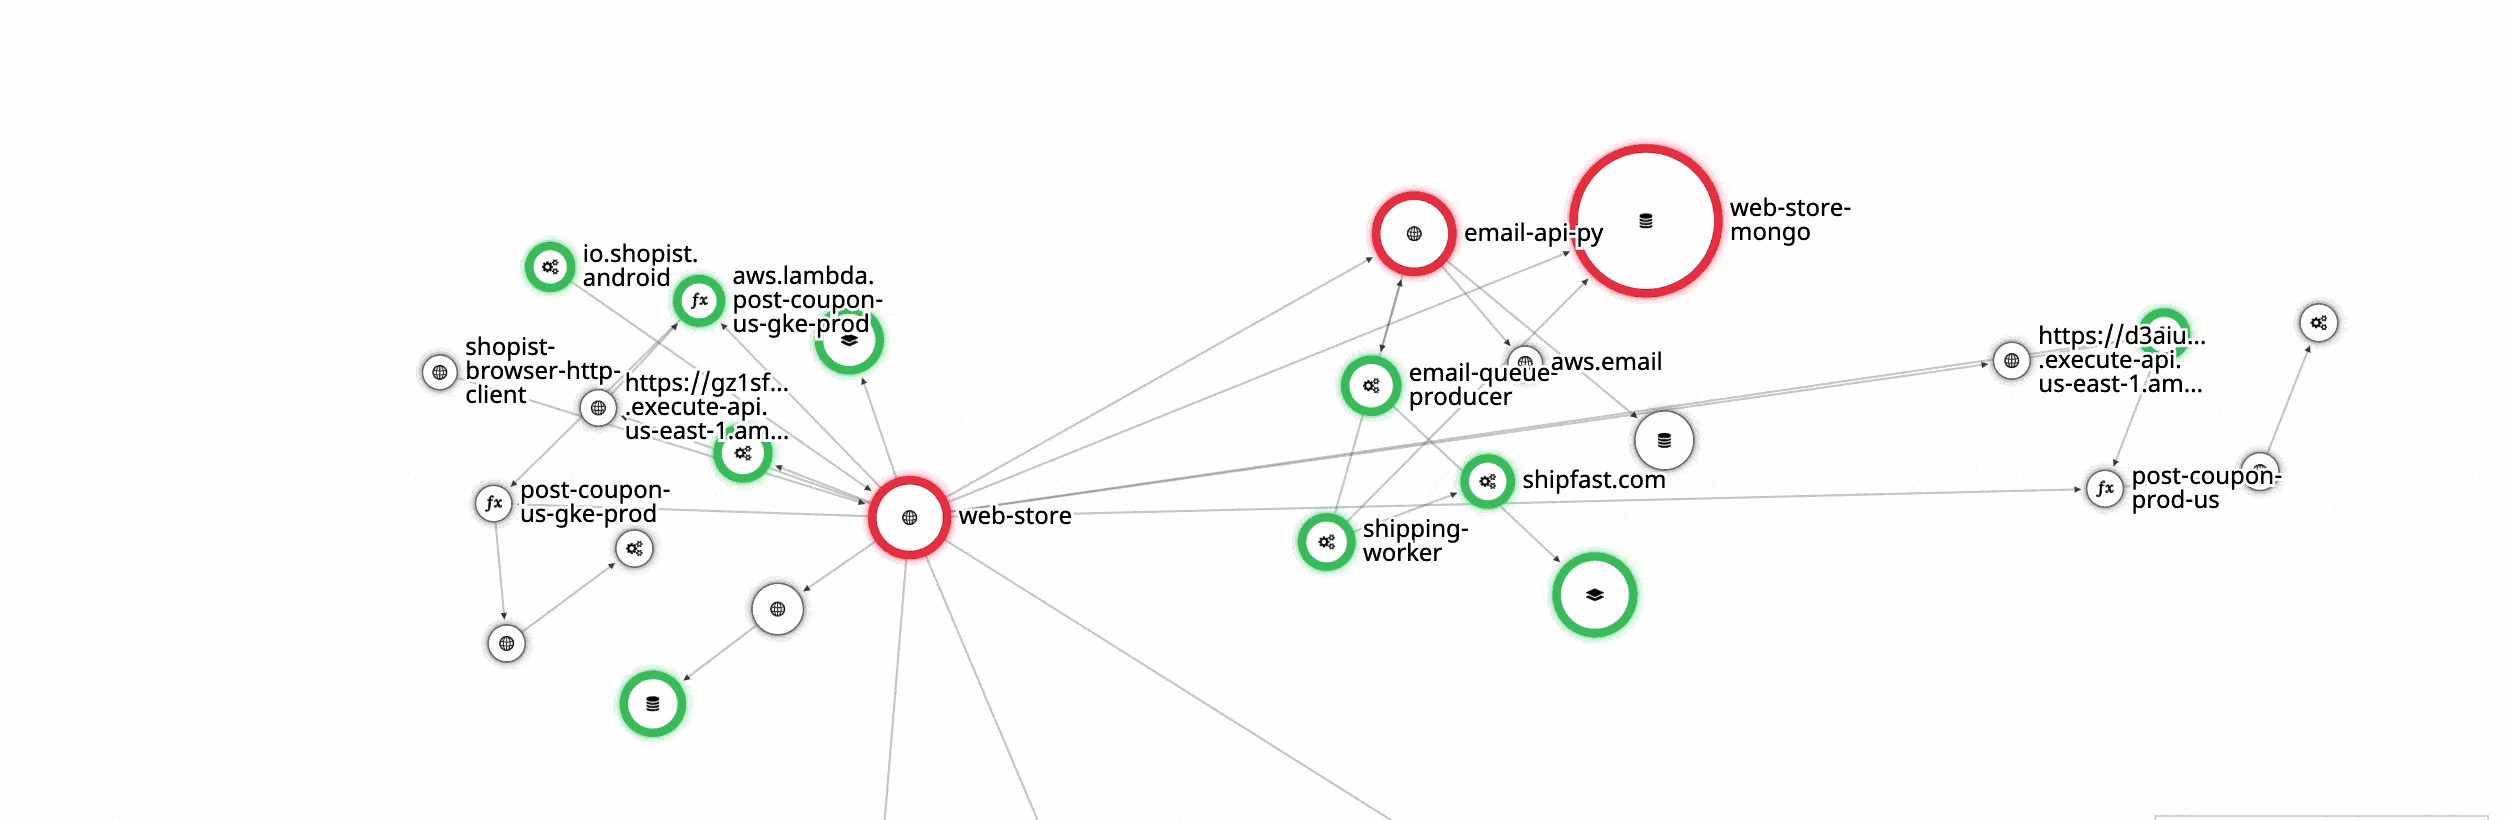
- Services Map creates a visual overview over every component within APM & RUM instrumented applications.
- Like Logging Without Limits, Tracing Without Limits allows for collecting & processing all application traces through Datadog in a low-cost way, archiving and dynamically deciding which are most important.
- Deployment Tracking, added in Oct-20, allows for tracking continual releases of application code through CI/CD tools. With their API integration capabilities, Datadog makes it possible to tie the control of your CI/CD stack into the platform, in order to better automate deployment and testing application deployments via Synthetic Monitoring.
All of these modules interconnect deeply. Users can correlate application traces for back-end services across infrastructure, network devices, and application stacks like containers, Kubernetes, and serverless functions. RUM was more closely integrated with APM, to better correlate user sessions in the front-end with back-end stack traces. Then came Continuous Profiler in Aug-20, which integrated the underlying application code. Datadog now provides end-to-end tracing of a user's request, through the network, the infrastructure, the front- and back-end app stacks, and now into the underlying codebase. It is up to customers to decide how many of those tiers to add into their app tracing (what layering of products they subscribe to).
This is all just the start. Application stack management is a heavy focus of Datadog, with major new features and product lines added regularly. The CFO, in recent Berenberg Thematic Software Days Conference in Jun-21, stated:
For instance, in APM, some of the investments that have been made have been additional languages, improved tracing, correlation of tracing with the other products, tracing without limits, more recently, profiling, which allows you to look at the code. And then we'll talk later about -- we've just acquired a company, an app security, which we intend to put in the app product to, again, to increase the functionality of the APM product.
Observability, over it all
All of these infrastructure- and application-focused products combine into becoming a complete DevOps tooling platform. One view over everything in the application stack, from high level dashboards to granular metrics, from network and service overviews to tracing a real user's usage through the front- and back-end stacks. And teams can not only watch application stacks closely, but can inject their own metrics for tracking business objectives in real-time, including alerts around Service Level Objectives (SLOs).
Another feature appearing a lot recently in observability and cybersecurity platforms is Digital Experience Monitoring (DEM). These are tools for testing how the application front- and back-end are performing, from the perspective of the users that are utilizing it. Datadog has this covered between RUM and Synthetics, in order to track front- and back-end usage in real-time, as well as to be continually testing the stacks as they deploy. Many other companies are adopting DEM features, including all the major observability platforms, as well as cybersecurity platforms like Zscaler, with its Zscaler Digital Experience (ZDX) product announced in Nov-19. [More on this in a later Premium piece.]
ML, over it all
Datadog's ML engine, Watchdog, debuted in their APM module, but later expanded into Infrastructure in Jan-20, and now sits above all modules. It helps provide continual monitoring, alerting, and forecasting capabilities around any metric, including business objectives and SLOs. Datadog recently added Root Cause Analysis features in Jan-21, to correlate metrics and causality across an application's stack layers (infrastructure, app stack, app code, network). It further expanded ML features with Watchdog Insights over Log Management in Mar-21, which proactively parses logs in the background, to catch trends you might have missed.
Recent Moves of Interest
Datadog is moving beyond observability and more and more into a full DevOps platform.
Incident management, over it all
Extending several collaboration & ML features already in place, Datadog has greatly improved upon the usability of its platform with a new product line for Incident Management. Announced in Aug-20 during their Dash conference, it allows for a common interface for DevOps teams to detect, triage, and resolve incidents that occur across an app stack. Users can declare incidents, investigate, collaborate, resolve, or create a post-mortem. Watchdog can be tied in to help detect and find incidents, and to help automate resolution.
Olo (digital ordering platform for restaurants): At Olo it's critical to always have our finger on the pulse of our systems in order to keep restaurants up and running. While Datadog is already an important part of that, the release of integrated Incident Management can further improve our team's ability to respond quickly and effectively, in those times it matters most.
These features are butting up against other incident response features like PagerDuty, OpsGenie, and ServiceNow. [More on this in a later Premium piece.]
Security, over it all
Datadog has what I like to call "beach front access" to the underlying infrastructure, as their Datadog Agent is installed directly onto host systems. Datadog already has all the observability data across the apps, the app stack, and the infrastructure. It already has ML capabilities in Watchdog that are looking for anomalies. It is no surprise that they eventually transitioned all of this into security.
They are pivoting quickly into using their platform for security over apps and app stack infrastructure – migrating their audience from DevOps to DevSecOps. This expands the Watchdog features into a security focus, searching for MITRE ATT&CK vectors that might be occurring across your app stack.
The Datadog Cloud Security Platform has several components:
- Security Monitoring, announced in Apr-20, can analyze logs from all cloud infrastructure and app stacks in order to provide real-time threat detection.
- Cloud Security Posture Monitoring (CSPM) to proactively monitor all cloud environments. This feature will continuously check the configuration of cloud infrastructure and workloads, to detect any drift from the security & compliance controls in place. This initially debuted as Compliance Monitoring in Aug-20, and by July-21 was morphed into a more fully featured CSPM. Along the way, Datadog deepened its relationship with AWS and integrated it into the AWS Well-Architected Tool, which detects if best security practices are used in AWS services.
- Runtime Security, announced in Nov-20 in beta, provides threat detection capabilities by monitoring process & file activity across any server or VM within your environment. It scans for MITRE ATT&CK vectors in real-time, at the kernel level of the host – all from the same single Datadog Agent as before (so is frictionless to start using). It can provide protection over cloud workloads by protecting the underlying Kubernetes and containers running upon the host, and can dynamically adjust with those environments. [LATER: Once their Cloud Security Platform was announced in Aug-21, it now includes a Cloud Workload Security (CWS) product. I believe what was once Runtime Security has fully morphed into this, as they have since removed their original Nov-20 beta announcement post, and now redirect that link to the Aug-21 post.]
- Threat Intel features were expanded in Dec-20, allowing users to further enrich detection rules & signals by using turnkey intel sources. Datadog Security can now accept 3rd party signals from partners like AWS CloudTrail, SignalSciences (in-app security), Twistlock (container security) and Lacework (cloud security) services.
- And in an encouraging move, they just partnered with Salesforce in Jul-21, to provide real-time monitoring & threat detection over their cloud platform.
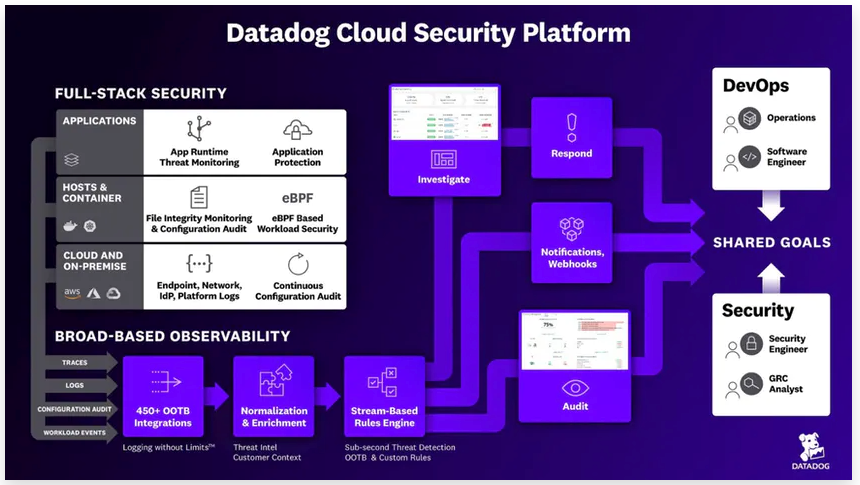
All security features tie into all the same platform features as before, such as Incident Management, Watchdog, Alerts and Dashboards. It also ties into Logging Without Limits, so security logs can be archived, and past incidences brought back for review under Log Rehydration.
There are many ways these security features can go from here. Moving into a DevSecOps focus added a new audience (security team) to the mix, and Datadog has mentioned they are seeing different set of buyers for Security products – so are still investigating the best GTM strategy. These features are butting up against CrowdStrike and Zscaler, who both have CSPM and Cloud Workload Protection features that are cropping up. [More on this in a later Premium piece.]
App-level Security
Beyond the infrastructure and application stack security features, Datadog has been investing heavily into application security.
In Oct-20, Datadog partnered with Snyk into a deeper integration for application security and runtime vulnerability analysis, using curated intel sources. In Datadog's blog post on the partnership, they described Snyk as a developer-first security platform over an IDE, version control and CI/CD, to provide vulnerability analysis over code. They maintains a vulnerability database, enriched with intel sources, to risk score, and all Continuous Profiler customers can leverage it free of charge. This threat database is in use by a wide range of infrastructure security-focused firms, like Docker, Linux Foundation, Rapid7, Redhat, and Trend Micro. Later, in Dec-20, Datadog and Snyk extended the partnership, to add a Github Action (sold on Github Marketplace) for vulnerability analysis. Dynatrace later partnered with Snyk as well, in Jan-21.
Then, in Feb-21, Datadata acquired Sqreen, a service providing application-level security for distributed architectures. They were bought for $260M, and are used by 800+ teams currently. They provide a platform for:
- Runtime Application Self-Protection (RASP), which protects an app from real-time attacks from within that app's own runtime environment, looking at requests for anomalies to prevent a variety of app attacks.
- Content Security Policy (CSP) & Security Headers are an HTTP response header to prevent certain types of HTTP-based attacks.
- In-app Web Application Firewall (WAF) provides a firewall embedded within the app, microservice or API. It inspects all incoming traffic, and uses pattern-matching to detect & block malicious traffic. Being embedded allows it to use the entire context of app to narrowly apply security rules.
This security product is likely to greatly appeal to users of APM. Once again, Datadog can leverage their "beach front property", this time with their APM SDK (which is already installed into application code), and now leverage it for security purposes. In the Q121 Q&A, CEO stated he was not sure what the sales process looks like yet, but believes they have a lowered friction to sell RASP/WAF security with APM. This is entering the markets of Imperva and Signal Sciences (bought by Fastly in Aug-20). This helps developers provide proactive security, and not solely be reactive in threat detection. In-application RASP and WAF security are unique features that no observability competitors currently have.
[LATER: Later in Aug-21, their Cloud Security Platform officially launched. The recent Sqreen acquisition is now in beta as an "Application Security" product. It may only be part of Sqreen, as the PR had no mention of a RASP product yet. I covered how RASP works in a later Premium piece, and how Datadog's APM product is well positioned for integrating it.]
CI/CD Pipeline Mgmt
It is now best practice to use CI/CD tools to deploy and automate builds. App stacks and infrastructure can now be programmable via Infrastructure-as-code tools like HashiCorp Terraform, which is vital for highly distributed application architectures like SOA & microservices within container-based stacks. With programmable infrastructure, even single tenant stacks are way more easy to manage, where you are deploying your service onto dedicated internal resources -- like Snowflake does with its Virtual Private Snowflake edition (private copy of its platform on resources dedicated to that individual customer).
Distributed architectures need different deploy techniques, and these can be better automated with the right tools.
- Blue-green = Deploying a new copy of production environment for isolated testing, then putting into the mix via load balancer.
- Canary deploy = Deploying a new copy of production environment for select users to try first.
- Shadow deploy = Deploy secret copy of production environment, pushing a copy of all production requests or service messages to it in order to fully test it in secret, to test real-world performance.
- A/B deploy = Mix between blue-green and canary that allows deploying new services or front-end GUIs to test how classes of users respond to changes.
The programmability of app stack platforms is leading to the programmability of CI/CD workflows, in order to better automate how these app stacks build and deploy. Tooling will help tie in the dynamic nature of app stacks like Kubernetes and containers, as well as the programmability of infrastructure available with Infrastructure-as-code tools. More automation can allow companies to prepare services for surges in user traffic, or optimize costs during quieter periods.
Datadog first showed how to integrate it's platform more closely with CI/CDs in Jan-19. They then released the Synthetics product line in Jun-20 to run tests and hook more closely into CI/CD platforms. In Aug-20, they acquired Undefined Labs, a service that helps provide better visibility and integration into CI/CD workloads. This helps this better adopt the Shift Left philosophy of DevOps tooling, where testing is done early and frequently. Undefined Labs had 2 products, which were immediately discontinued (to be integrated into Datadog's platform directly):
- Scope = A modern testing platform to turn tests into insights, with an intelligent test runner.
- Ctr.run = A process to simplify container builds for developer and deployment needs. Works locally, across CI providers & container runtimes.
A new "CI Visibility" product is coming from all these moves, which is now in Datadog's documentation as a private beta (but not the official product list). I fully expect Datadog to start adding more and more CI/CD pipeline management features to better control app deployments. They could be getting more and more into JFrog's space, a software and release management platform to control CI/CD pipelines. [LATER: They soon officially released their CI Visibility tool into beta in Jul-21.]
Conclusion
Datadog is shifting from an observability platform into a fully fledged DevOps platform that can monitor, control, and react any modern application stack. Infrastructure Metrics, Logs, and Network Performance help IT operations. APM, Serverless, and Continuous Profiler help developers, further enhanced by RUM, Synthetics and CI/CD Visibility tools. And add in all the AI, Automation, Incident Management, and Business Intelligence tooling over it all.
Security is becoming part of that equation (DevSecOps), but they are still finding their way there. They are doing threat detection via MITRE ATT&CK scans across hosts and dynamic app stacks, but they have work to do to be a fully fledged SIEM, with SOAR and UEBA feature sets, and turning Watchdog into a full ML system for threat detection. They aren't on the Gartner MQ for SIEM yet (like Splunk and Sumo Logic are).
Add'l Reading
This post was originally written in Jul-21 for my Premium service, which also has 2 other related pieces. If you want to learn more about cloud infrastructure or modern application architectures like containers, Kubernetes or serverless functions, I wrote an intro to this piece entitled "A Brief History of Application Development". I also wrote a later piece that further explored how Observability platforms are expanding into other directions like AIOps and Application Security, and how Datadog is well positioned for app security features like RASP. If you want to take spin with the Premium service, sign up!
If you want another extensive take on Datadog, Software Stack Investing previously wrote up his thoughts on the last 3 quarters of Datadog's earnings, including Q421, Q121 and now Q221. They reiterate many of these same points, and, as you can see in comparing our takes, I couldn't agree with his take more.
- muji