
ElasticON is a one-day developer conference run by Elastic (ESTC), the company around Elasticsearch and its associated toolkit known as the ELK stack. This conference has been around a few years. It started in SF in 2015, spread to wider audience across key towns (SF, NY and DC for Fed govt focus), then got so popular that it is now a road show they do in various cities (up to 30 now across US, Canada, EU and SE Asia, so likely it's in a city near you).
Elasticsearch is a product I use. I built a time-series engine upon it that helped me make an application service for internal users to utilize for analyzing and especially visualizing their research data. Unfortunately for me, I didn't keep up-to-date on major versions on Elasticsearch, so it's getting pretty stale - for one, I need to upgrade to better expose it to dashboarding tools like Kibana or Grafana. I am constantly seeking more info about the Elasticsearch ecocycle, and talking to their developers and support engineers at events like this is amazingly helpful in my decision making on where to go next, as well as where to utilize Elasticsearch going forward as it becomes applicable to more and more use cases.
This conference is great for someone like me, a software developer making decisions about data engines to use within our architecture, and is using their engine as part of my stack. It was a very relevant conference for me -- it always is, which is why I've attended for the last 3 years now.
This year was the best it has been, and was really well run. This company has it down. There is a big room for main presentations and a (new this year) side theater for breakouts, all around a centralized room with the riff raff, like Elastic "Ask Me Anything" help desks, vendor booths, and where all the food/drink is. This manages to center the socialization aspect of the conference, and as an attendee, you find yourself out there chatting with a wide array of Elastic staff who can answer your questions: talk with a presenter, a high level solution engineer, a senior manager on the very product you use, and even with decision makers at Elastic. Beyond that, you can speak to any vendor or attendee about anything -- with vendors, to hear like similar customer stories or how their product solves a related need, and, with attendees, often to compare use cases and hear how they are leveraging Elastic products in different ways.
Better yet, all the sessions are taped and eventually made available online - so once they are published I can go back and revisit, or pass it along to interested peers that didn't attend.
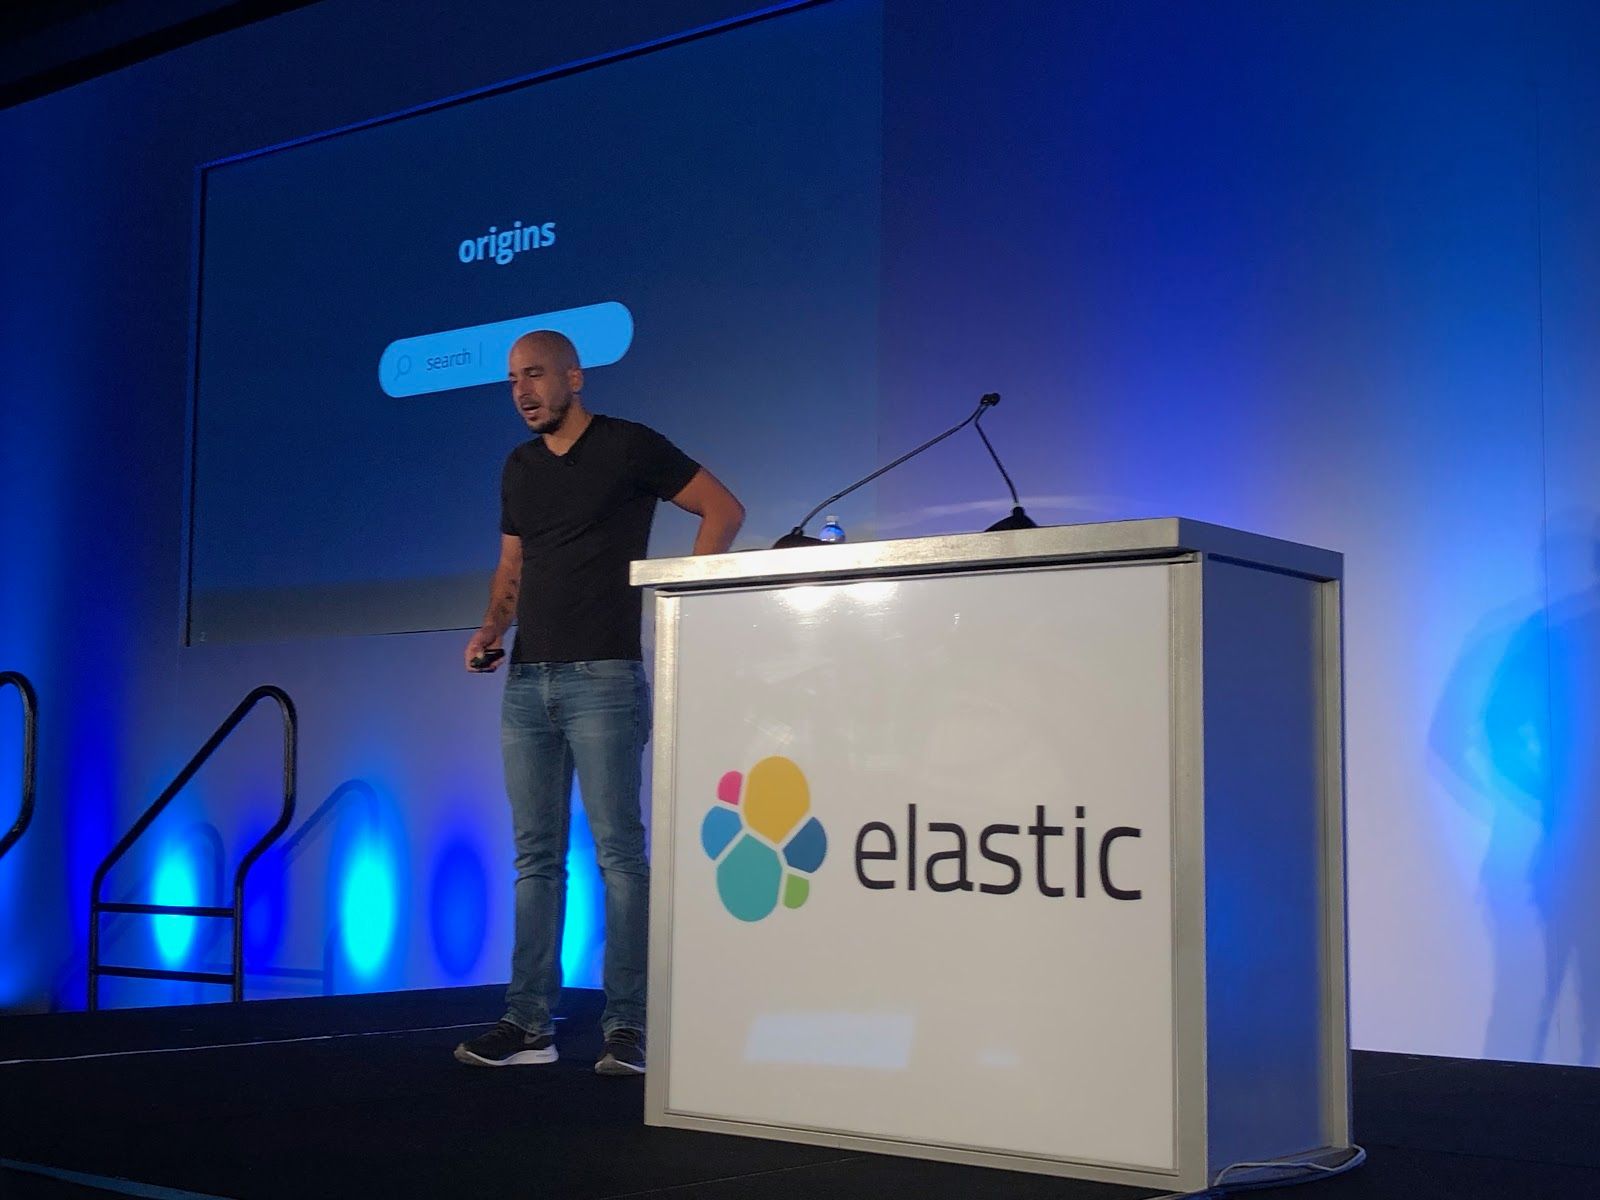
It was kicked off by CEO Shay "Race" Banon. (I don't know if he has that nickname, but dammit, he should.) He is the developer who wrote the original Elasticsearch open-source software over the open-source Lucene indexing engine (which in turn was written by Doug Cutting, of later Hadoop & Cloudera fame). Shay then formed Elastic, the company, around providing support for that software. He built the company, but then ultimately stepped down as CEO... only to come back in mid 2017 (see details in this great blog post). He's not only the CEO, but also chairman and CTO to boot. And his name is pronounced "shy", which I mention to avoid you the potential embarrassment of calling him "shay" at some point. (Even if wasn't said out loud, you owe me one.)
So he is a former developer who is now a leader - and an idea man throughout. As comparison, this is how I would describe Jack Dorsey, current CEO/Founder of Twitter (again) as well as CEO/Founder of Square. However, Dorsey is making highly visible products directly used by end users. Elastic use is all behind the curtain; only developers & business users likely truly understand their suite of products.
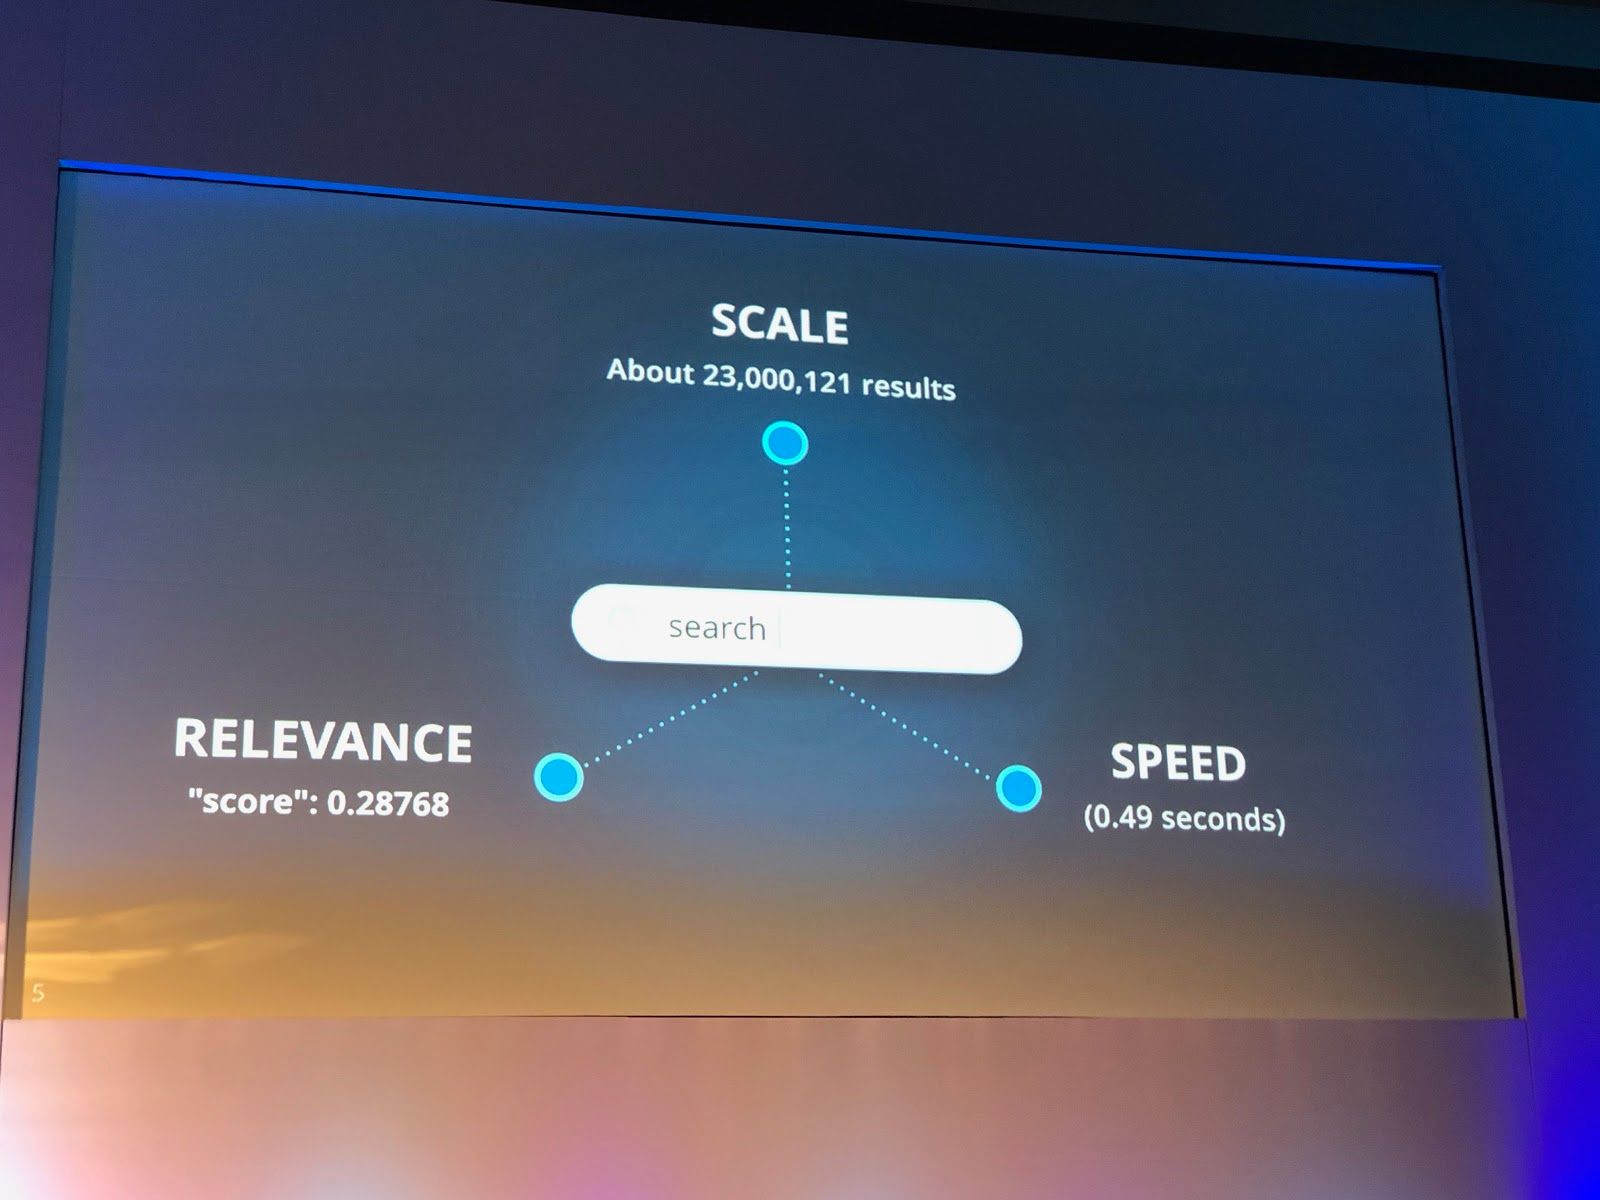
At its heart, Elastic is a company betting on search. There is a lot of data out there, and it needs to be sliced and diced, filtered and sorted, and visualized and analyzed. They started with their open source data engine built around indexing, made a company around supporting that software, and since then have continued to expand the suite of products that customers need around their use cases in using it. They are setting themselves up for success -- as your needs scale, so does Elastic's product (and its support costs). This company is following a tact very akin to how MongoDB (the product and the company) succeeded -- create an open-source data engine, support it, then start expanding into managed hosting in the cloud -- and reap the increase in recurring revenue that that brings in beyond the support subscriptions.
Shay has a vision. He excitedly tells us this vision for the first 30 minutes of what was to be a tightly scripted day of sessions. And as Shay (remember, it's "shy") and his employees presented, it is becoming very clear to me who this company's true competition is … Splunk, New Relic, and Datadog... and let's throw in Influx as a competing platform (those last two still private).
My take from this conference, from an investment standpoint, is that Elastic's next wave of growing is in monitoring. Companies are finding it cheaper to bring monitoring infrastructure internal. As companies succeed and grow, it becomes an ever-growing expense to use outside monitoring services (aka SaaS companies like Splunk, New Relic, and Datadog), as the amount of data hosted is typically always expanding.
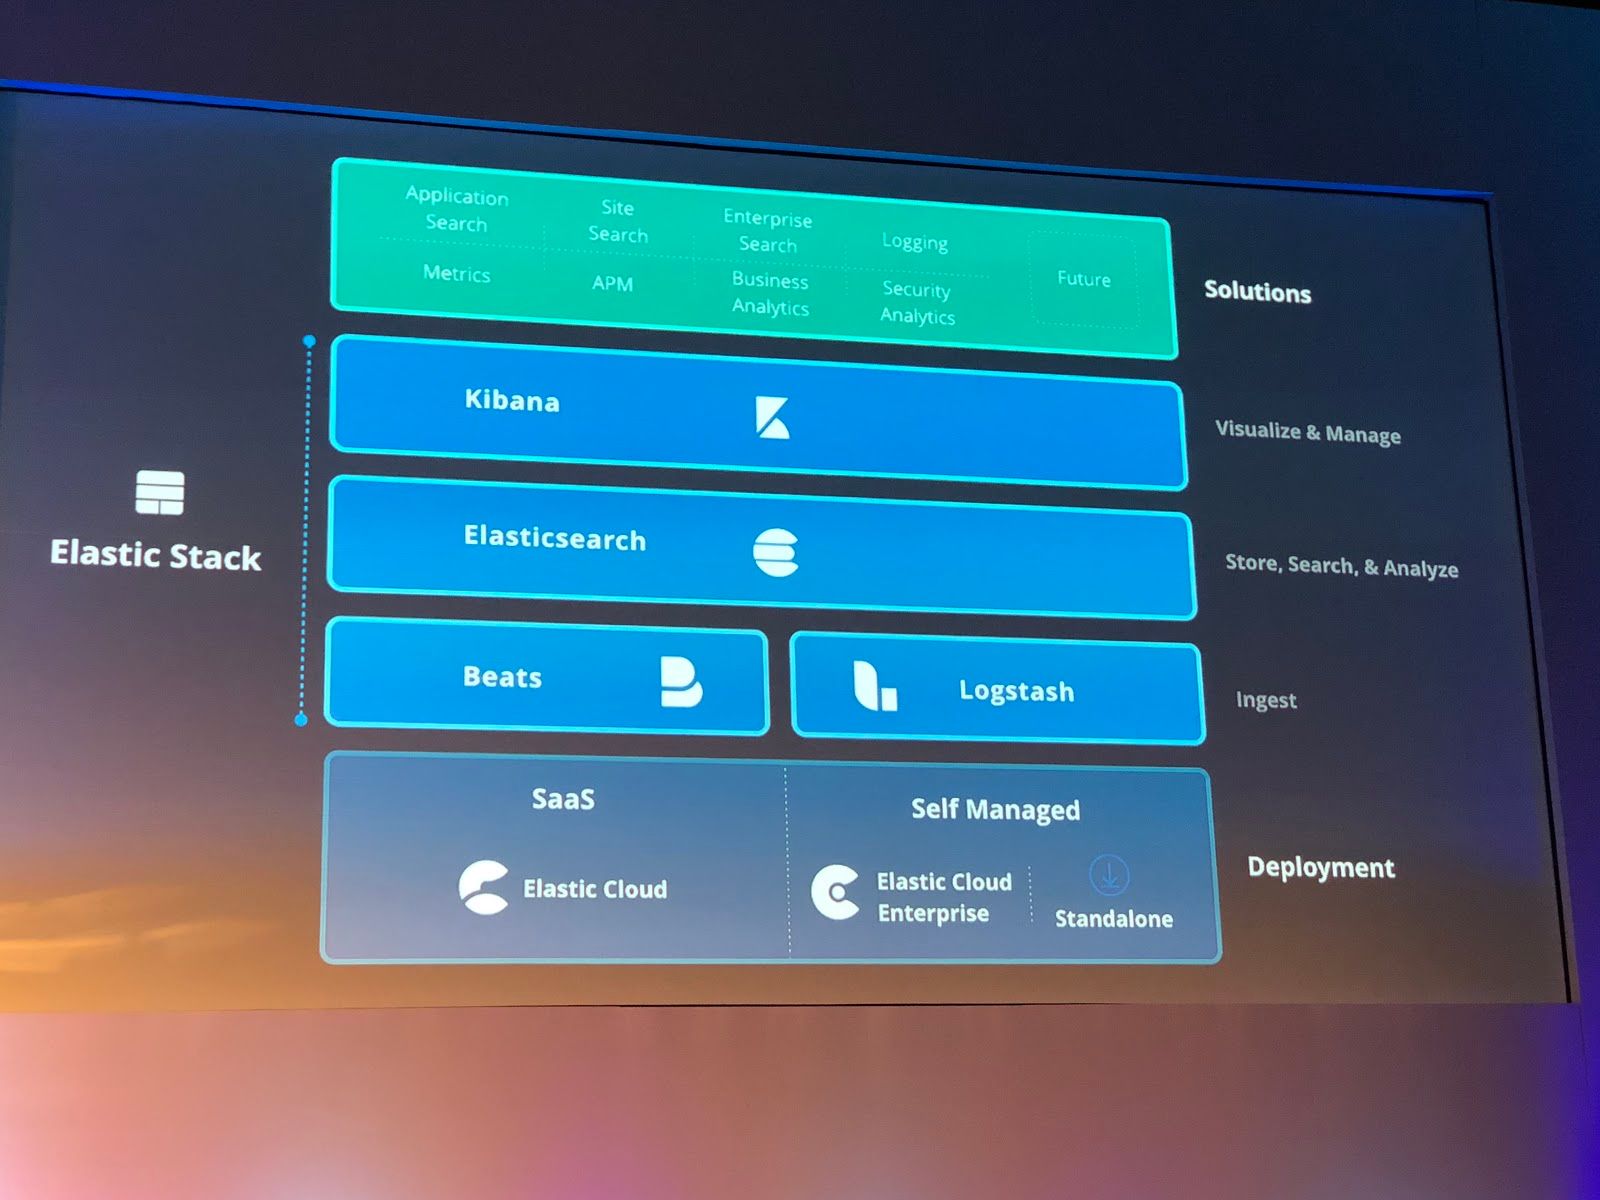
Every attendee already knows the major parts of the entire stack as their history is covered by presentors. The underlying engine under it all is Elasticsearch, an immensely scalable search-oriented data storage platform that requires a lot of effort to install, manage and monitor. Logstash and Beats get the data into it. Kibana, Timelion, and now Canvas help you make sense of it by visualizing it. Elastic, of course, sells support for helping install, manage, or develop against any of its applications in its stack.
Like MongoDB with its Atlas product, Elastic has a hosted service called Elastic Cloud, where you can spin up ELK clusters on demand, and that run on top of the 3 major cloud providers (AWS, Azure, and Google). This means Elastic can run all the infrastructure for you, eliminating installation and ongoing management costs. This is especially useful if your infrastructure or your data sources are already on one of those cloud providers. As competition, AWS provides its own AWS Elasticsearch service, and like Elastic Cloud, it allows you to control the version of ELK you spin up, up to the latest stable version. Elastic is moving fast with ingest and visualization sides of their stack and greatly expanding the plugin nature of monitoring. The big advantage AWS has over Elastic Cloud is that it is tied into other AWS services more integrally, so if you are an all-AWS shop already leveraging Lamba, S3, EC2, RDS, IAM and the like, you will most likely go with AWS Elasticsearch.
As a third delivery for ELK use, they have offered a product called Elastic Cloud Enterprise for the past year and a half. ECE is the best of both worlds, and is basically having Elastic Cloud in-house -- a cloud platform that you host within your enterprise data center. It would have to be deployed on some kind of hardware cluster -- similar to what a Hadoop deployment would require. (Nutanix converged hardware would be very appropriate. Perhaps using VMWare or Red Hat OpenStack to manage it as instances, or extend it further with Red Hat OpenShift or Kubernetes to manage it as containers.) With ECE, you could offer a platform-as-a-service (PaaS) to internal users in order for them to make on-demand ELK clusters on your enterprise's internal cloud. This would be highly appropriate for my situation, as we have a lot of internal infrastructure already, and ephemeral needs around a wide variety of data-driven projects that are coming and going. If we solely used Elastic Cloud on AWS, we'd be sending a massive amount of local data over the internet pipeline to fill it. It's much faster and cheaper for us if that service was hosted locally, and that data transmission was solely internal (within our switches and gear).
The overall message at the first half of the conference is "Observability". You need to monitor all things! Their target is companies with a lot of infrastructure to watch. Nearly every company requires a tech infrastructure these days, and has processes it needs to monitor (marketing campaigns, web pages, web and mobile apps, APIs and microservices, etc). Whether you are running your own hardware infrastructure or are leveraging the cloud, and whether you are using bare metal, or VMs, or using containers, you need to see what is going on at all times across your business and its products/services.
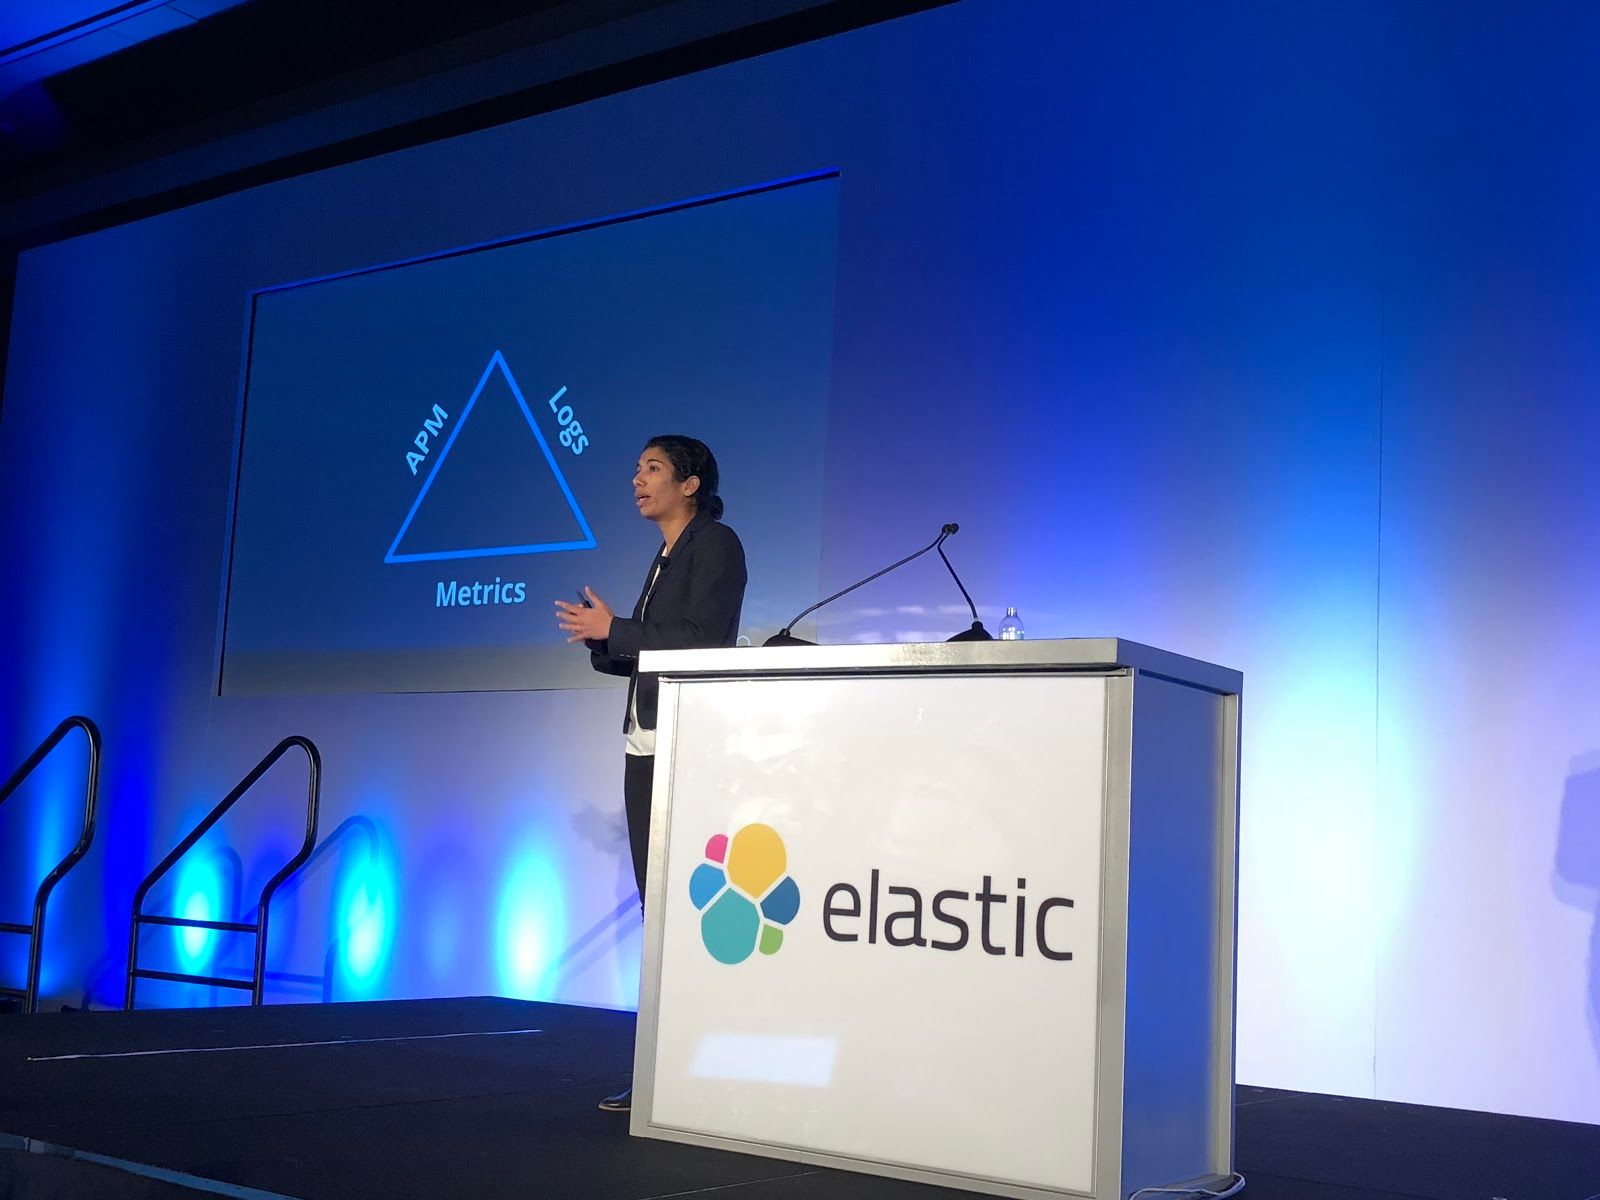
The pillars of their monitoring solution is logging + metrics + APM. This means logging from the OS and data engines and applications, metrics from the server software and hardware it's running on, plus performance monitoring from the applications running over it all.
Tracking log data has been the entire reason they created the ELK stack. Data ingest comes via the Logstash tool (the L in ELK) and its configurable data source plugins, which can pipe the various system and server-side logs into Elasticsearch (the E in ELK). Users can then do ad-hoc search and visualize the data via the Kibana dashboard (the K in ELK). Beyond that, they can use the Timelion plugin in Kibana to query & visualize time-series data in particular. Going further, Kibana is making huge improvements in Machine Learning modules for things like anomaly detection.
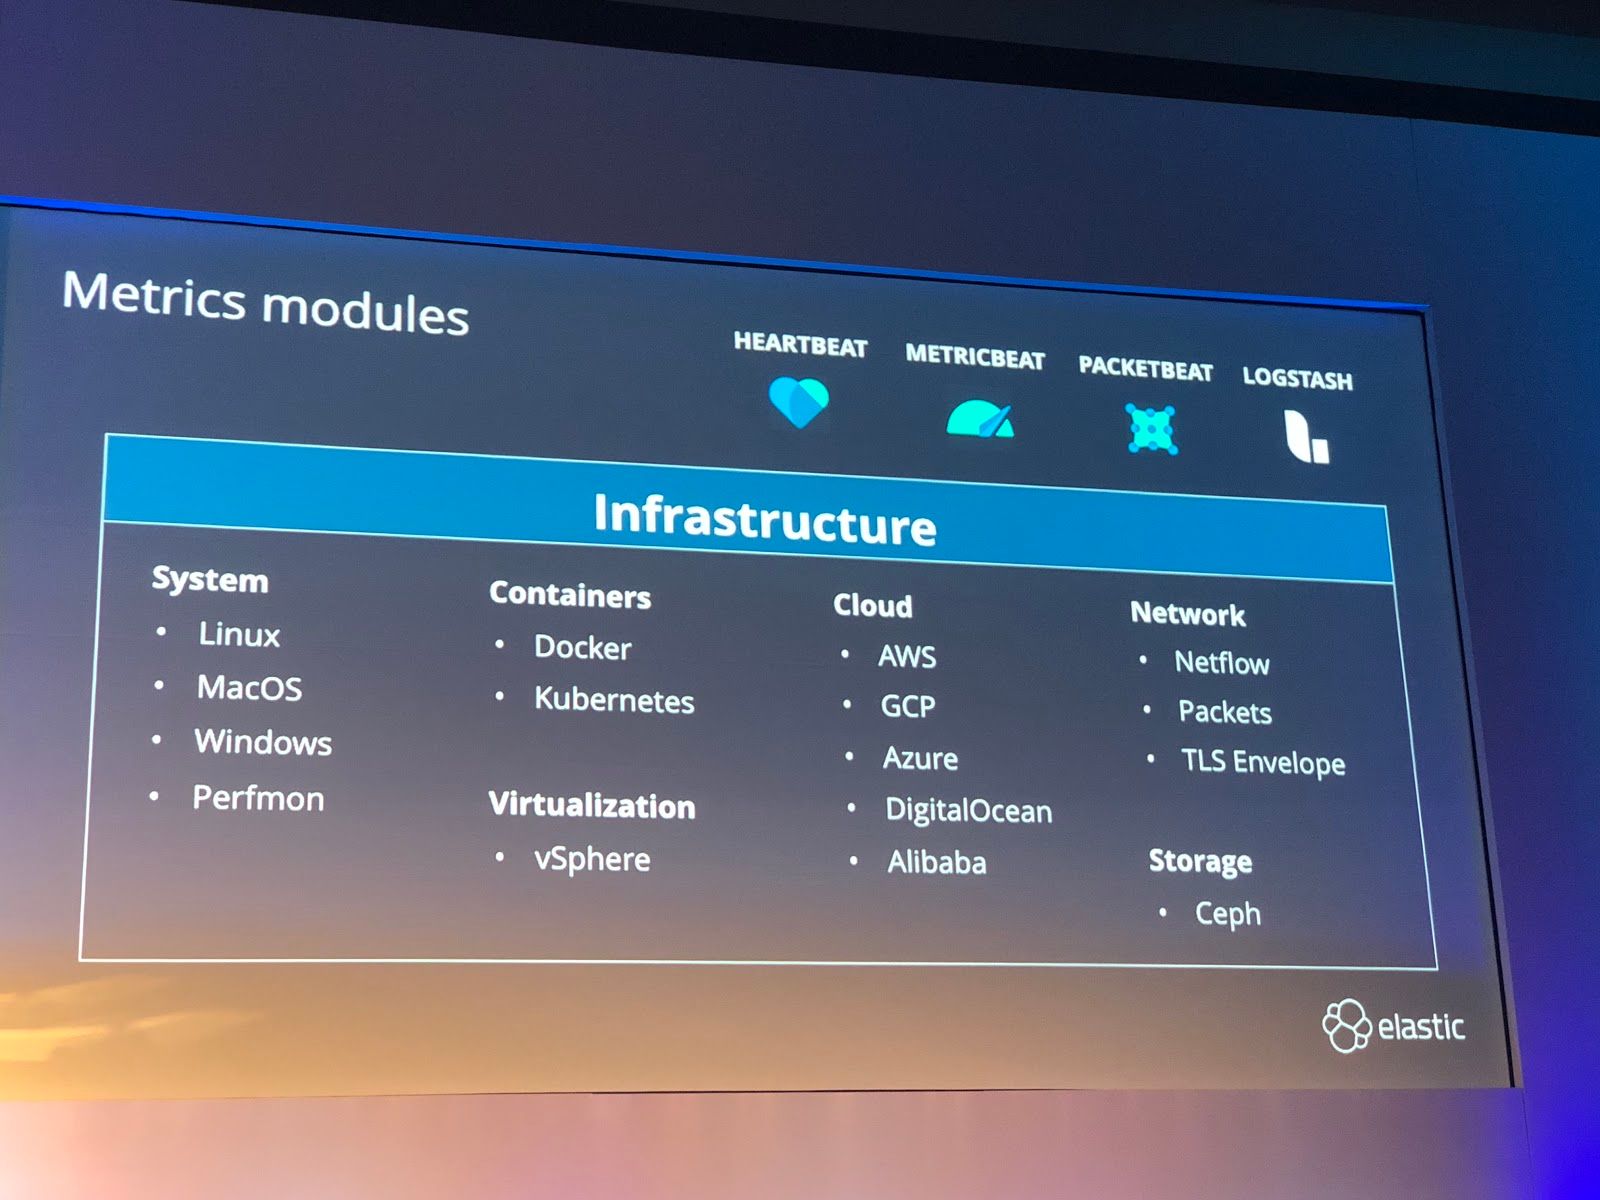
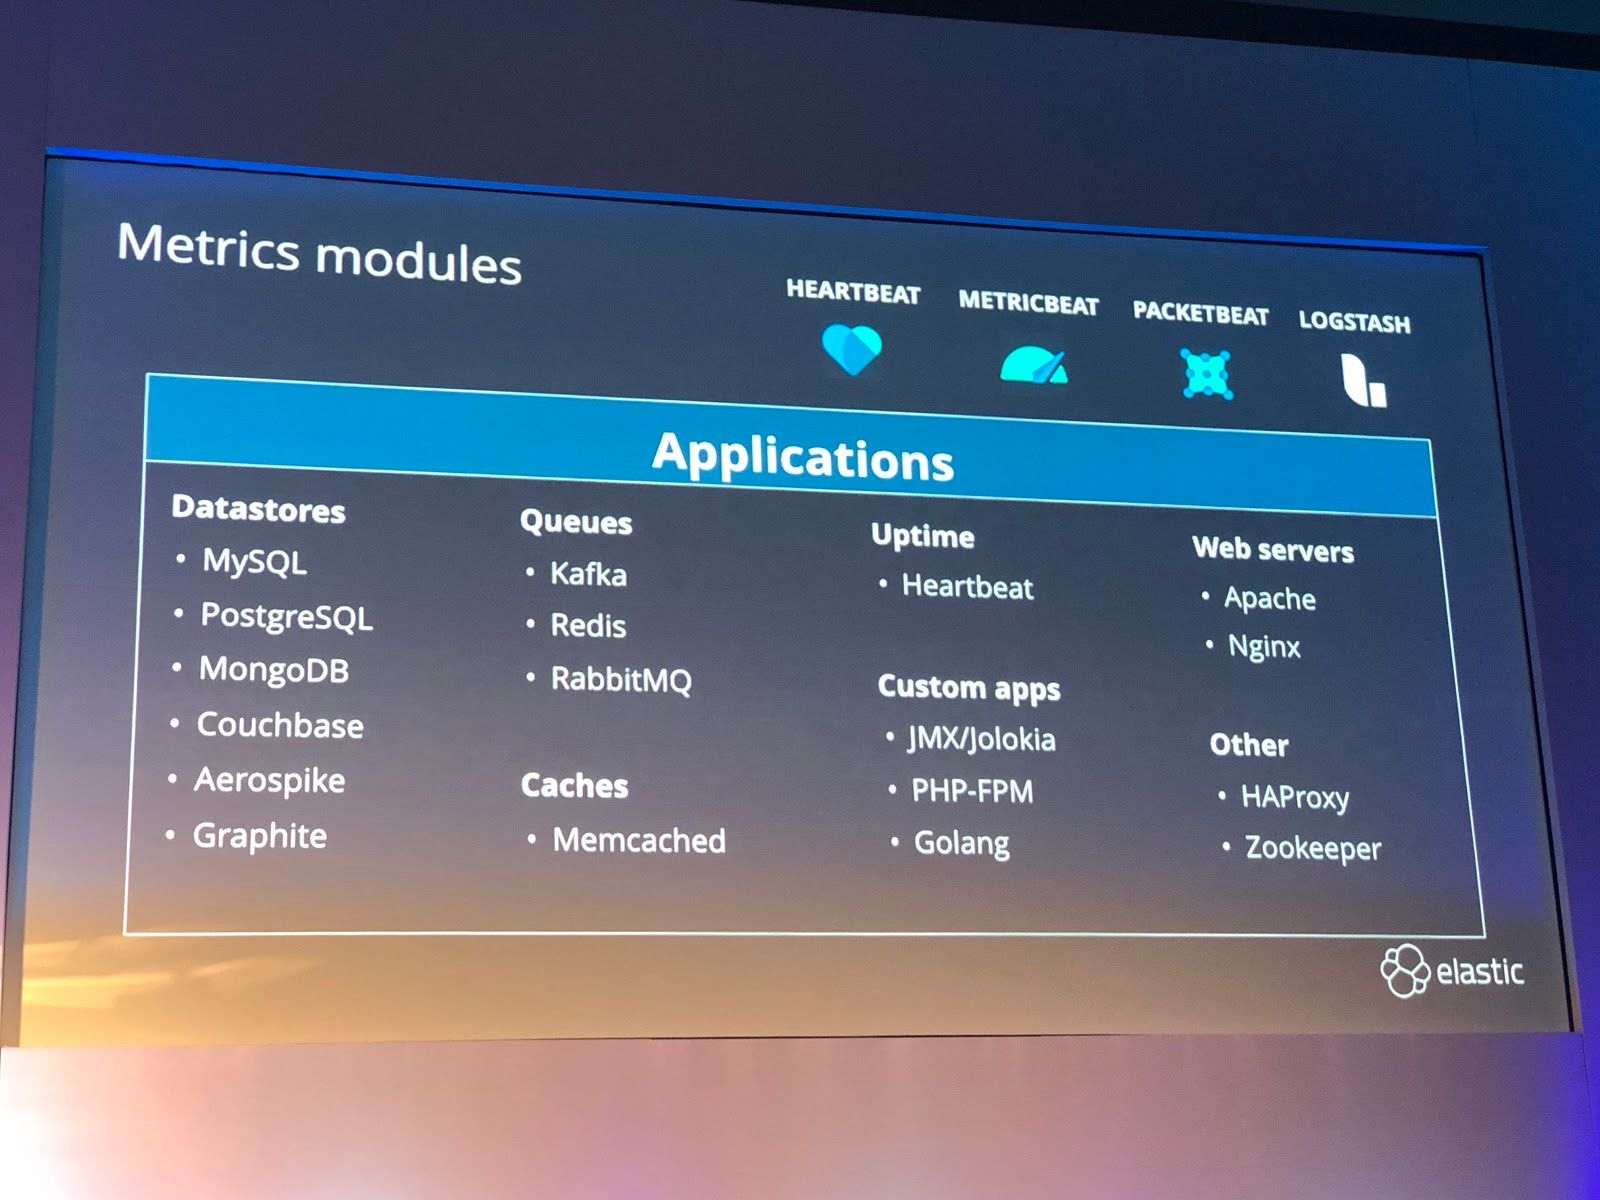
Metrics means capturing the telemetry data off the services that you run - the operating system, databases, messaging stacks, Hadoop clusters, Kubernetes clusters, and web servers. Plus the metrics from the containers, VMs, or the bare metal OS (cpu, memory and network metrics) that those systems run on. Containers magnify your monitoring problems, as does using cloud hosted services.
You cannot just blindly run these tools and engines that drive your business -- someone has to watch over things and solve problems when it all goes wrong. Metrics must be collected and watched! They have added a wide assortment of plug-in methods to Metricbeats (inputs) and Kibana (outputs) for server-side applications you would like to monitor (databases, web servers, deploy tooling). They called it "curated services" in describing it. For instance, you can now just tell it to monitor your nginx web server, set it up via configuration file, and after data is in place, it creates a new Kibana dashboard tailored exactly to the vital metrics of that particular application for you. Monitoring your entire stack, over a wide variety of components, is now starting to be provided 'out of the box' in ELK stack.
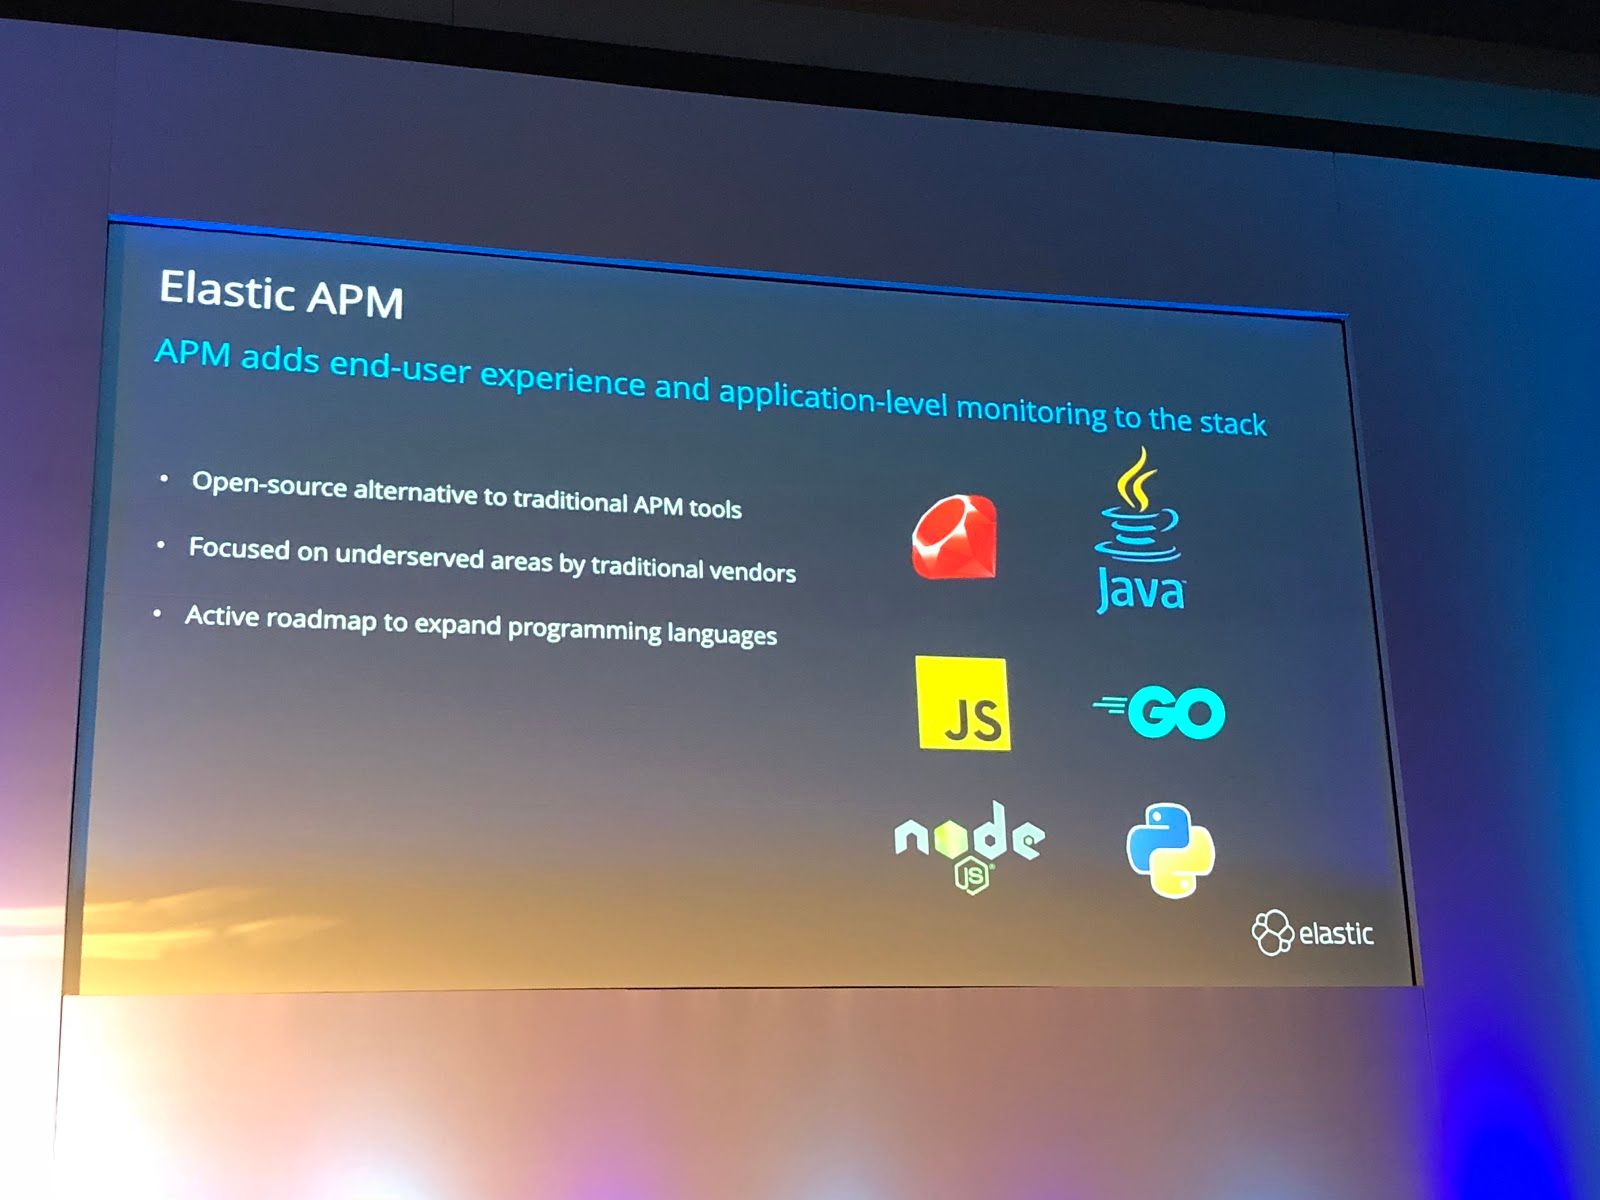
The third leg is Application Performance Monitoring. APM is relatively new to the platform toolkit and is the the new leg of their monitoring marketing, but it's pretty much just extending the concept of the capturing the logging and metrics, but instead of tracking just the system, its pulling in the application and API logs too. Microservices and other container-based application development and deployment schemes allow for deploying and scaling easily, but they also require a lot of monitoring. As was the case for plug-in metrics, you can plug your application monitoring directly into all layers of ELK, through a variety of language libraries (Python, Java, JS, Go, Node, Ruby, etc).
If you monitor all 3 directions, this in turn gives you a complete picture of your entire businesses infrastructure in one place. And if people are using Elastic products for monitoring, they are not using outside services like Splunk or New Relic.
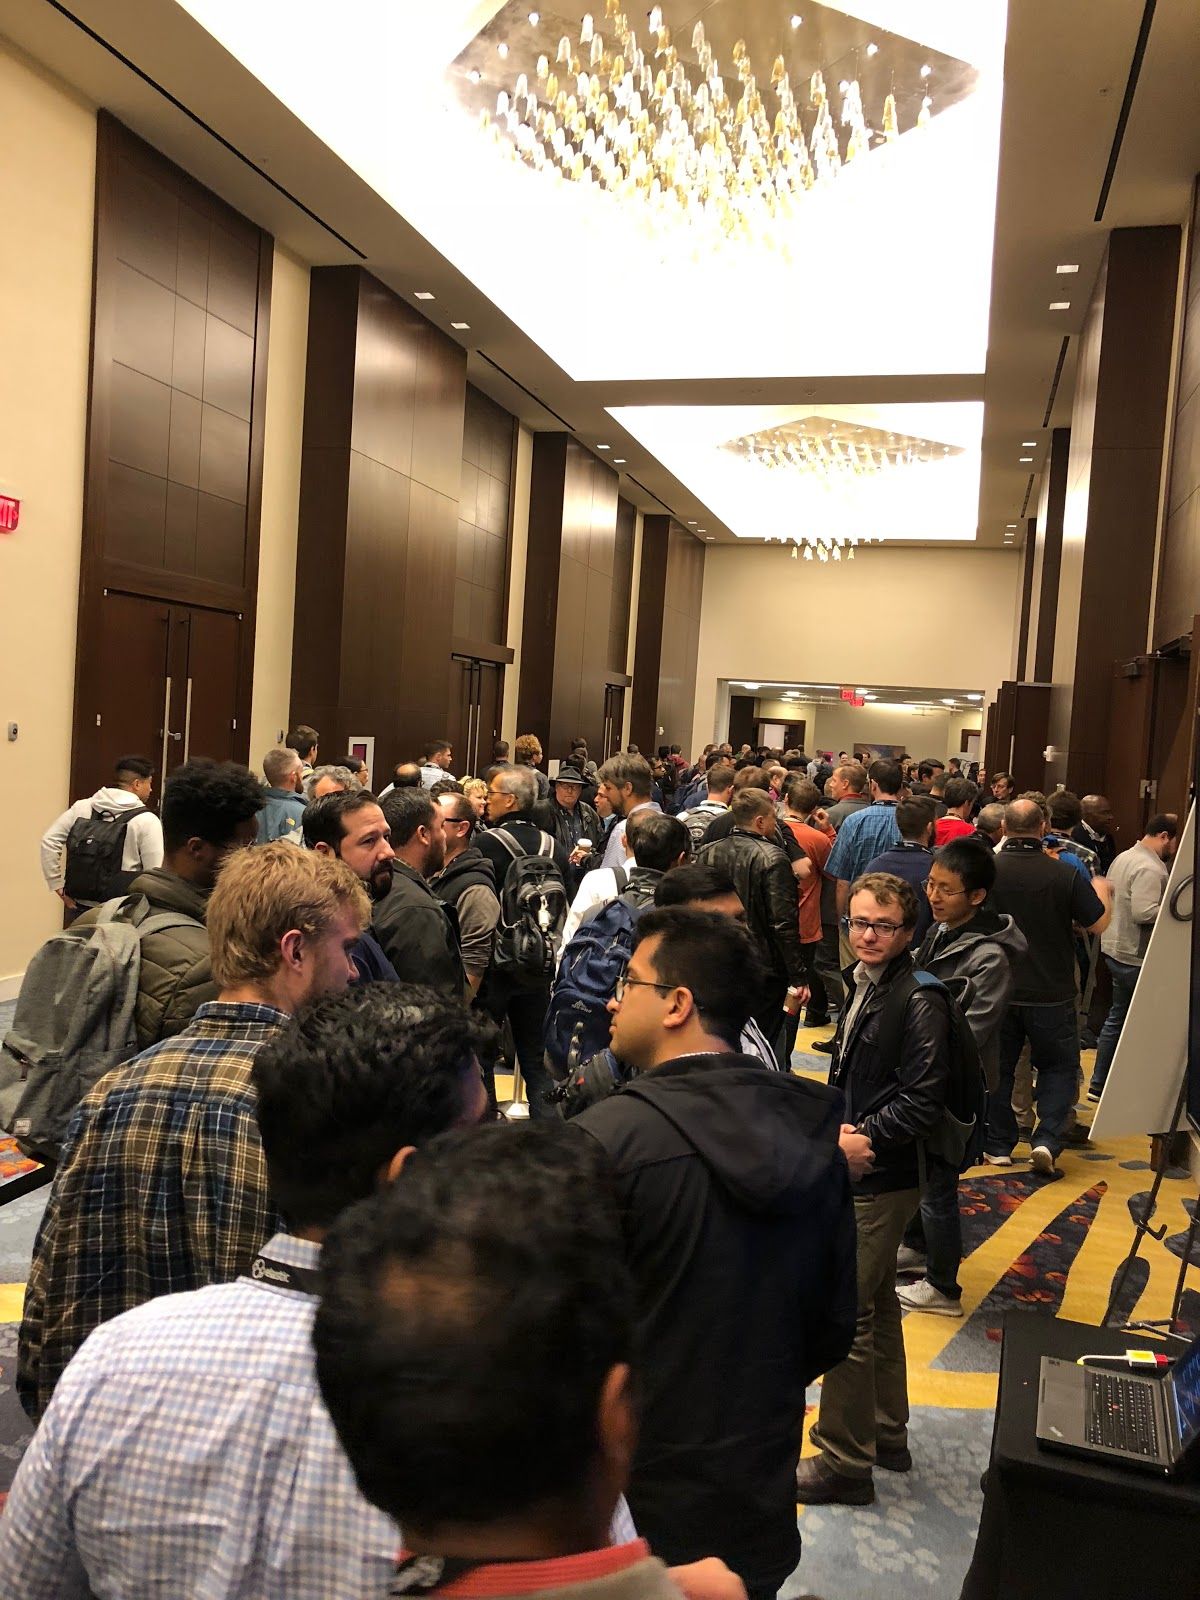
It was well attended. Companies are being successful with using Elastic for their specific use cases -- and that list of use cases is expanding. Like MongoDB's strategy, land-and-expand is at play for the recurring revenue from software development efforts using their products.
After all the Elastic employee presentations, the conference split into 2 separate tracks for end-user use case presentations. One was about managing & scaling the stack, the other was SEIM -- which is a fancy and rather ugly acronym basically meaning cyber intrusion event detection (aka find the hackers that are hacking) by monitoring network traffic and firewall logs. It is a major use case of ELK stack, and has been a main focus of the conference over the years. As the core "Observability" purpose is growing, Elastic provides a solution as "a stack that can watch all the things" - whether it's monitoring the infrastructure, the applications, the networking, the geolocational proximities, and so on.
So overall, the conference focused on a showcasing a few new features, especially the new SQL language support, the new Canvas infographic-building tool (SVG graphic editor with in-line querying of Elasticsearch), time-series improvements, and how they are improving curation of indexes and cluster - including adding a management interface in Kibana UI. Of all those, SQL support is a crucial new feature for me -- it opens up a lot of possibilities for getting more data scientists to be able to easily access data from my system.
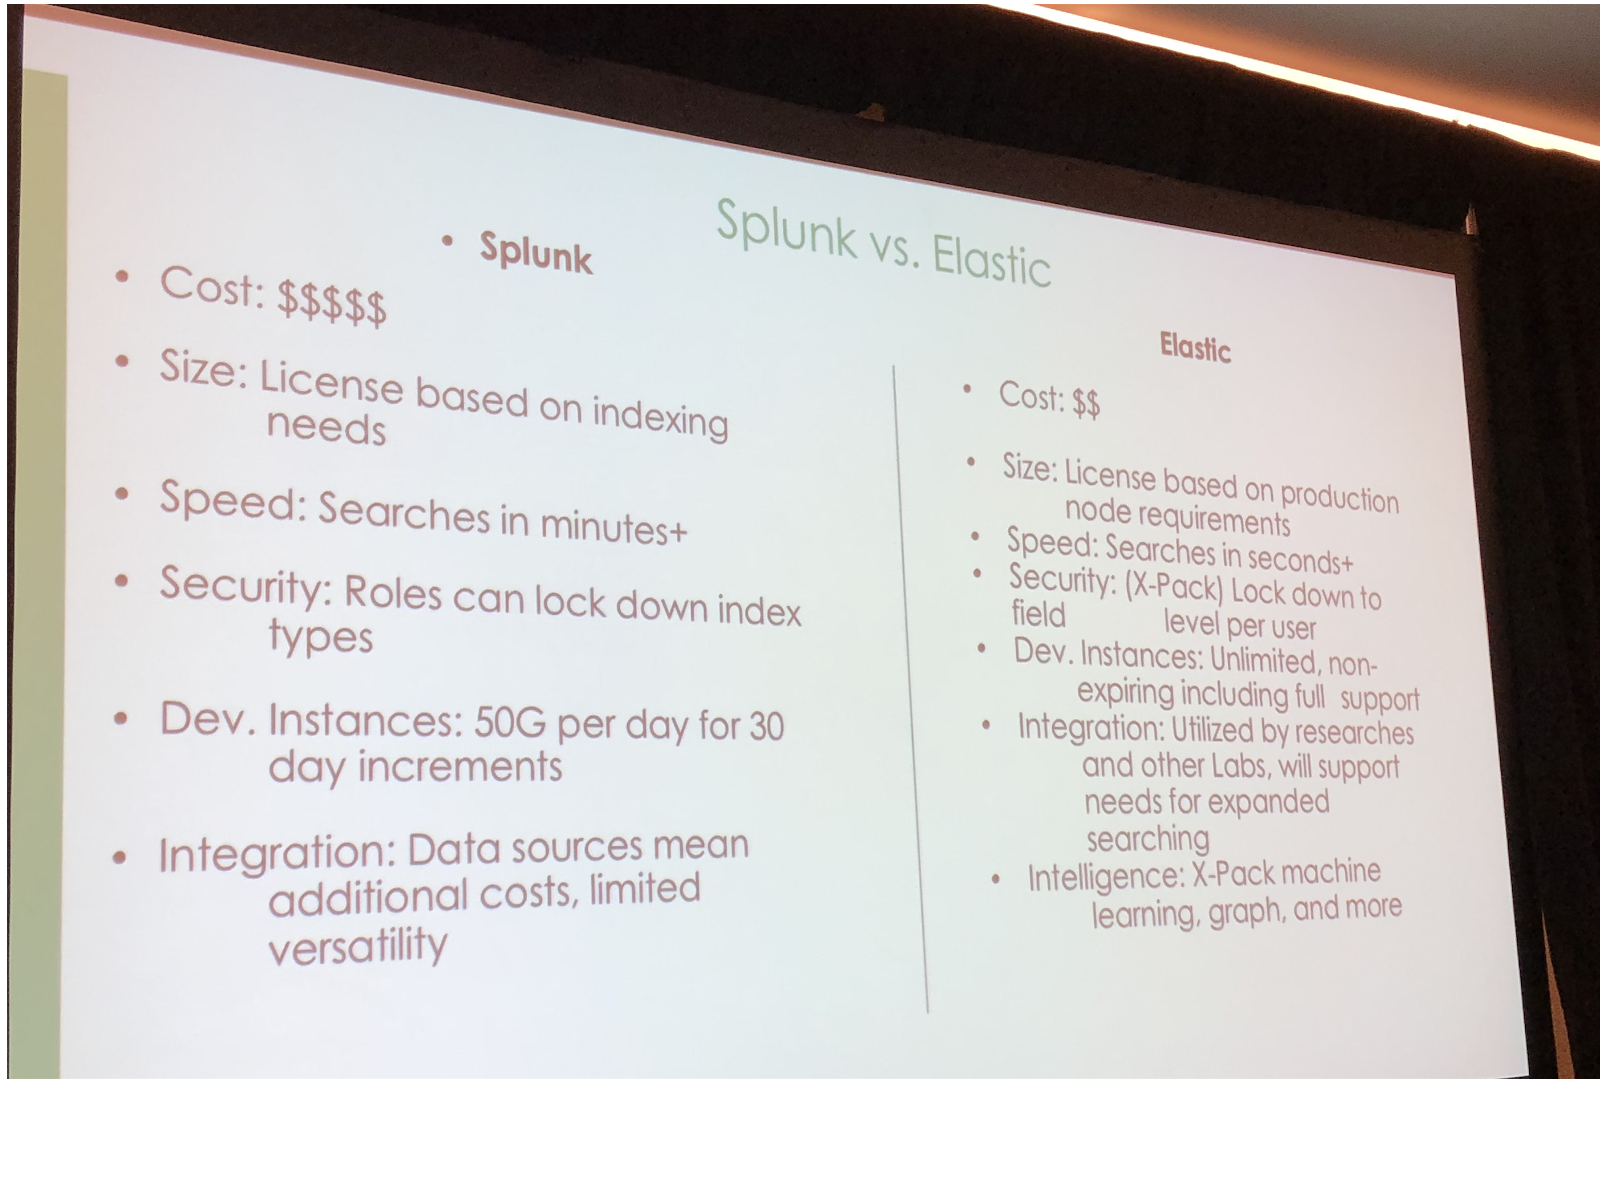
One interesting use-case presentation worth mentioning was an organization that built their own cyber monitoring & intrusion detection system using open source tools (Nifi to collect logs, Kafka for transport, Elasticsearch for search, Kibana + Timelion + the new Canvas app to visualize on dashboards). They then developed their own machine learning system over it. They converted to this system from using Splunk for all the log ingestion and analysis, as the new in-house Elastic stack gave them a greatly reduced ongoing cost, massive speed improvements (secs vs mins), increase of throughput & space, more granular security, and more optionality (easier to integrate other intelligence tools and add’l data sources).
Some facts of their setup:
- 2B new data points per day (1B from firewall alone), needing 1.5Tb storage a day
- All clusters use Docker containers to centralize architectural mgmt & put setups into templates
- Kafka runs as 6 node cluster, for fault tolerant data transmission
- ES runs as 25 node cluster on 25 VMs running on HP Converged infrastructure
- Reference query took 1m26s in Splunk, now takes 1.6s in ES
- Costs shown as going from $$$$$ to $$
How does Splunk win against companies taking their monitoring infrastructure inhouse? Only by drastically cutting prices. But creating your own stack is not for everyone… the ELK stack does have its costs to install and maintain the cluster, in staff, hardware and time (or in costs to the Elastic Cloud or AWS Elasticsearch to do that for you). There will also be a large percentage of users that prefer the convenience of having a cloud service do it all for you instead -- but as companies needs grow, and their hosted data grows to a massive size, expect more and more moves to Elastic stack for the specific reasons the company mentioned above -- lower costs, more speed & scale, and way more optionality.
Companies are building mission-critical systems on the Elastic software stack. As those companies grow and succeed, and as their use of Elastic stack grows -- Elastic can only help but grow as well. By the end of the day, I was pretty excited about Elastic the stack, as well as Elastic the investment.
- muji