
A dog-leg in golf is a hole that veers out of sight from the tee so that you cannot see your target. It seems an apt term for a company that is shifting left and right in ways we can't yet see the final outcome. Today, let's take a look at what Datadog announced during its Dash customer conference in Oct-22.
Datadog hinted in its Q222 slide deck in Aug-22 (on slide 8) that several more products were coming in 2022. Peter Offringa and I had a fun conversation on my premium podcast back then that guessed at what going to emerge at Datadog's Dash conference in October. We took some guesses on the 5 "missing slots" they hinted at:
Peter: If I were to call it, I'd say there'll be maybe one thing in security, two things in, let's say, developer processes slash shift left. And then, and I wouldn't be surprised if we saw something new in [product] analytics.
muji: ... Whereas I think Universal Service Monitoring (USM), likely CoScreen we'll see probably tied into their incident response, cloud cost management that's absolutely gonna come. I think product analytics has probably a little further out and general business analytics even further out. I think application code is probably further out, but yeah, so many different areas they can explore. That's what's exciting about this company.
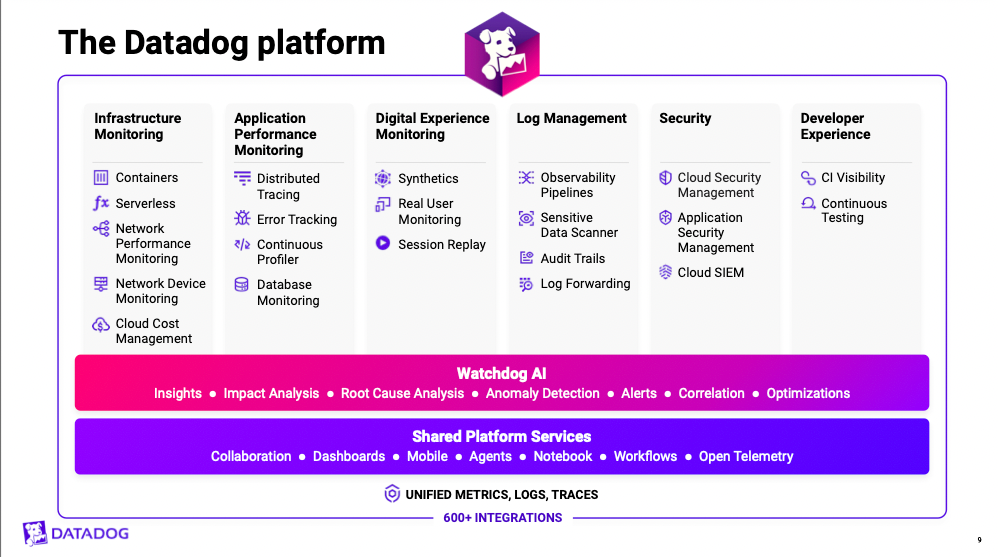
Datadog had its Dash conference in October to fill in the mysteries, debuting new priced products like Cloud Cost Mgmt, Continuous Testing, CoScreen, and Cloud Security Mgmt (unifying what used to be listed as separate CSPM and Workload Security products), and hints of others coming soon like Workflows and Data Stream Monitoring.
We both agreed we'd see new products centered on bigger moves into security and shift left, and they continue to heavily move into these areas. On the security side, they are moving deeper into automation, to move towards what you typically see from SIEM (security analytics & log mgmt) platforms getting into SOAR (orchestration and automation) – but it goes beyond automation of security processes to also automate DevOps processes, for automatically deploying and remediating issues in the app stack. On the shift left side, they now have a whole new product category called "Developer Experience" with several new product capabilities coming. Dash also brought us expected announcements like CoScreen and Cloud Cost Mgmt. No signs yet of a move into business intelligence like Product Analytics (such as what Amplitude, LogRocket, and Heap provide) – for now, Datadog is content to fully explore how to best serve developers and their role in these moves left (to developer workflow in CI/CD and code) and right (to overarching security over the app stack).
Dash
There was a lot to digest at Dash. Unfortunately, it was a bit scattershot, with different focuses coming from all the various info channels (PR, blog, keynote, sessions, and the investor presentation). A slide in their investment deck (#19) covered many of the announcements, but provided no details. A recap blog post started to fill in details, but even that got bogged down in enhancement details by the end.
The overarching themes of the Dash event and investor presentation were:
- They are "doubling down" on observability, moving deeper into more and more advanced capabilities to upsell into customers, and which helps them become an easier-to-use and stickier platform. Gartner projects this alone will go from a $41B market in 2022 to $62B in 2026. APM and DEM (digital experience mgmt), in particular, continue to be iterated on.
- They are "shifting left" by moving further into the developer workflows around the CI/CD pipeline. It always felt that CI Visibility was just the start, and they are now greatly expanding the product features in this direction, as well as are introducing some AI/ML and code-scanning features. [Faster than I expected.]
- They are starting to embrace the Cloud-Native Application Protection Platform (CNAPP) mantle from Gartner, and are distinguishing their security moves into cloud-native and application sides of the coin. Both of these are heavily focused on leveraging their DevOps audience as the go-to level for remediation of security issues within cloud-native app stacks, while giving security engineers the tools to oversee it all.
- They are not only focused on visibility over app stacks (observability and now security) but also now on taking action, by allowing one-click remediation in their dashboards and through the use of automation capabilities to trigger responses. This is what SIEMs typically integrate as SOAR (security orchestration and automated response) – but for Datadog, we should leave out the "S" for Security, as their automation moves also apply to DevOps processes and app stack deploys.
The last Dash [previously covered in premium] provides us hints as to what was still missing now a year later. The majority of those past products in beta had since gone GA except for Cloud Cost Mgmt and Universal Service Monitoring (USM). Both of those showed up at Dash, as expected, though to different degrees – with USM fully appearing a month later.
- GA pre-Dash: Service Catalog (part of APM & USM), Powerpacks
- GA at Dash: Cloud Cost Mgmt, CoScreen, Continuous Testing, Cloud Security Mgmt (CSM), Sensitive Data Scanner expansion, PCI & HIPAA Compliance, and Moderate GovCloud expansion
- public beta: Workflows, Intelligent Test Runner (in CI Visibility), Dynamic Instrumentation (in APM), Resource Catalog (in CSM), CSPM for GCP (in CSM)
- private beta: Data Streams Monitoring, Workload Security Profiles (in CSM), Events Mgmt
- GA post-Dash: Universal Service Monitoring (USM)
Datadog has a lot of different directions now, so I think it best to start tracking product release details across Observability (O11y), Developer Experience (Shift Left), Security (Cloud + App), and cross-slicing features which lie over all the others. This helps highlight how they continue to move deeper into developer and security processes (that I shorthand as moving "left" and "right"). I'm also going to skim over all the incremental improvements to APM, RUM, Log Mgmt, and the like, and just focus on the the more important moves into new features.
Observability
- they earlier announced Service Catalog (GA in Aug-22), a new capability in APM to catalog and track all distributed services within an organization and seamlessly tie in other capabilities like golden metrics, incident reporting, and viewing upstream & downstream dependencies [this is a huge part of the capabilities promised in Universal Service Monitoring, which came out later]
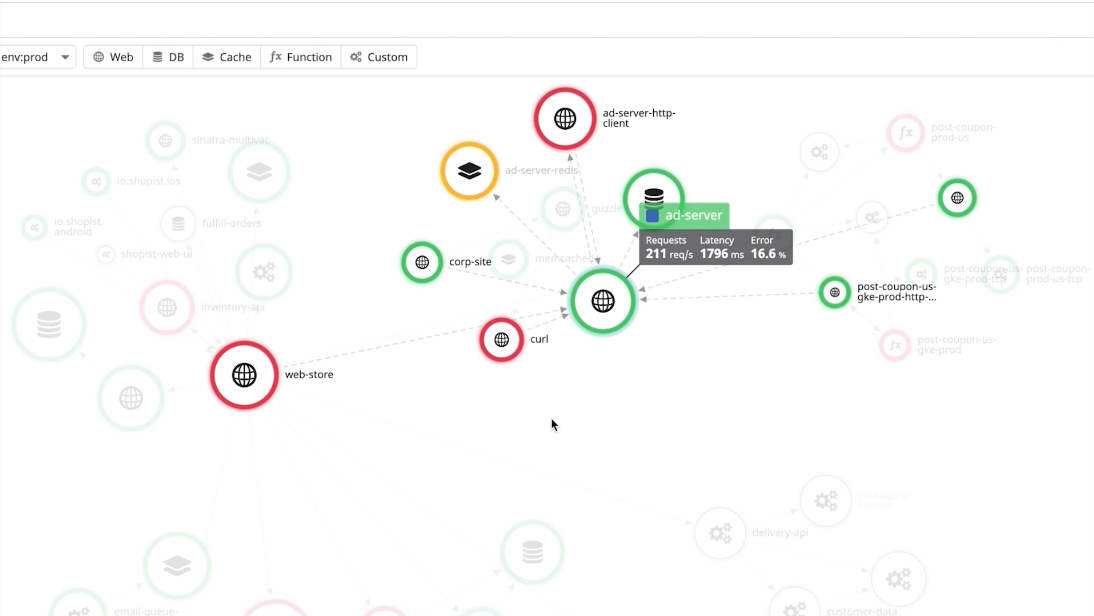
- they later announced Universal Service Monitoring (GA in Nov-22), to allow auto-detection & monitoring of all microservices across all of an organization's environments, and seamlessly integrate those services into Service Map & the new Service Catalog in APM
- they released Cloud Cost Mgmt (GA in AWS, others coming early 2023) to track the trends and changes in the costs of the underlying cloud infrastructure used in app stacks, and to tie those costs in as KPIs for DevOps to monitor and alert on
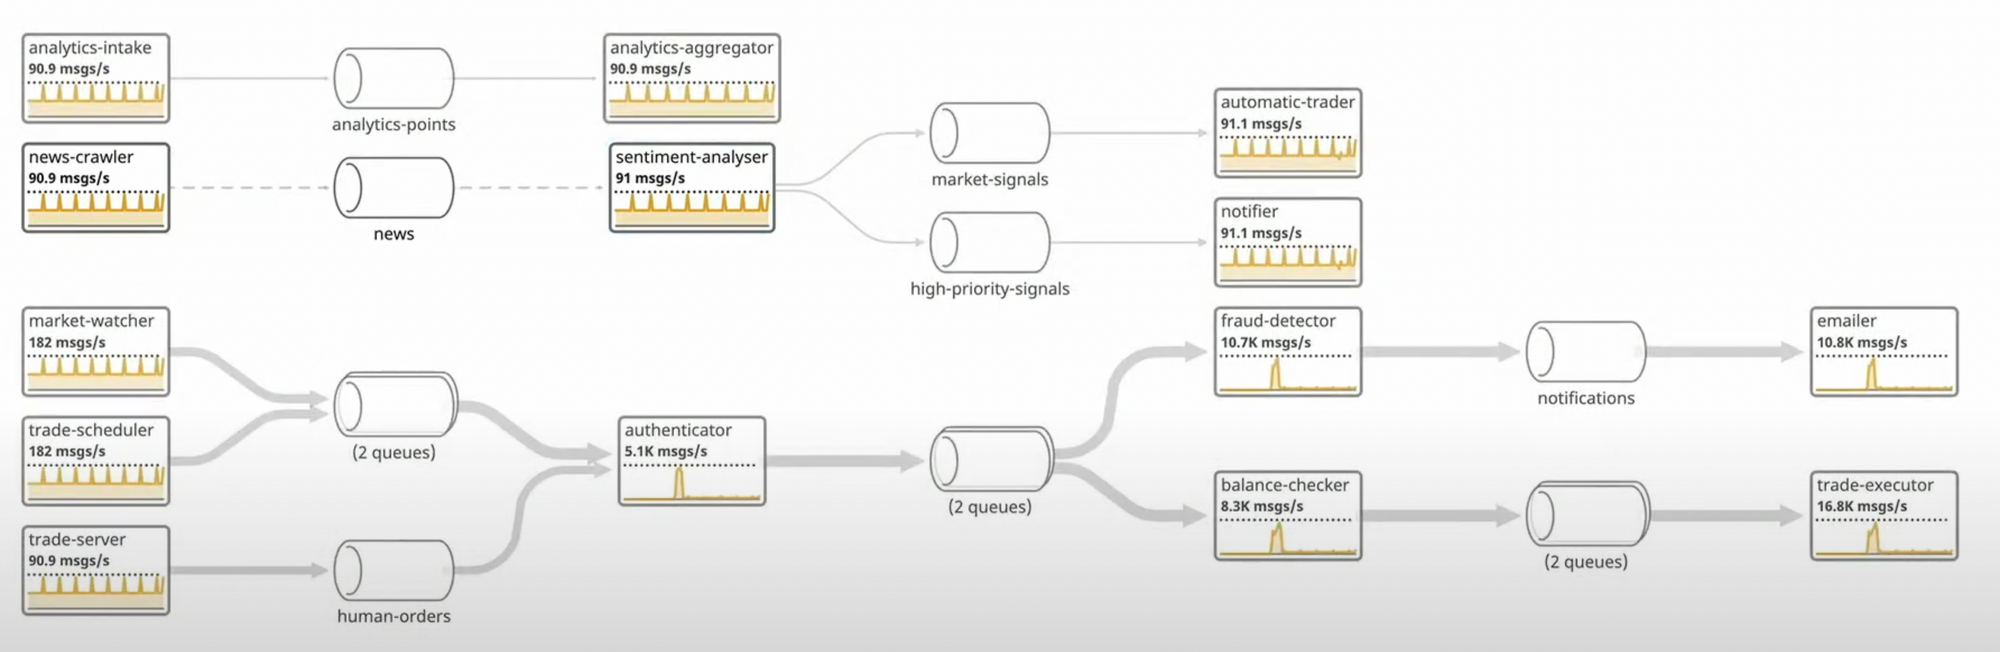
- they announced Data Streams Monitoring (in private beta), as a new capability for continuously monitoring event and data pipelines like Kafka, AWS Kinesis, and RabbitMQ, and the hierarchy of services built around them as producers, consumers, and queue handlers [no blog posts on this yet, but was featured in the keynote]
- they released CoScreen (GA), a tool for remote DevOps collaboration via screen sharing and video chat, as well announced a new tighter integration into Incident Management (in private beta) – all of which is from their acquisition of CoScreen in Feb-22
- they added Powerpacks (GA in Jul-22) as a way to create pre-defined dashboard templates used within an org
- they added OpenTelemetry support (GA in Oct-22), to enable using OpenTelemetry (OTEM) agents to send data to Datadog, and (vice versa) to use the Datadog agent to send data to 3rd-party platforms that support OTEM
- their blog highlighted o11y enhancements such as Sensitive Data Scanner being expanded from Log Mgmt to APM/RUM, a new Log Forwarder to 3rd-party services in Log Pipelines, and new PCI compliance for Log Mgmt & APM and HIPAA compliance across Log Mgmt & SIEM
- even more o11y enhancements include expanding test recording in Synthetics to mobile apps in iOS/Android, adding heat maps to RUM to see aggregate user behaviors for isolating UX patterns in front-end apps, a new no-code UI for building Observability Pipelines, and an expansion of products available in their new FedRAMP Moderate level platform in GovCloud [all only mentioned in a recap blog post]
Shift Lift
- they released Continuous Testing (in GA), to create, manage, and run automated end-to-end tests over web apps via session recording in Synthetics, tying it in with APM & RUM, and integrating with a number of popular CI/CD pipelines
- added a new Intelligent Test Runner capability in CI Visibility (in beta), which leverages AI/ML to isolate the areas of an app that a code change will impact, and only run those tests – which greatly minimizes the time in developer feedback loops during the build stages of CI/CD
- added a new Dynamic Instrumentation capability in APM (in beta) to allow developers to inject and track real-time debugging information into code and 3rd party libraries running in production – which has to be from their Ozcode acquisition in Nov-21, but they made no mention [no blog posts on this yet, but was featured in the keynote]
Security
- they released Cloud Security Mgmt (CSM) as a new overarching product line housing their cloud security products like Cloud Security Posture Mgmt (CSPM scanner) and Cloud Workload Security (runtime security)
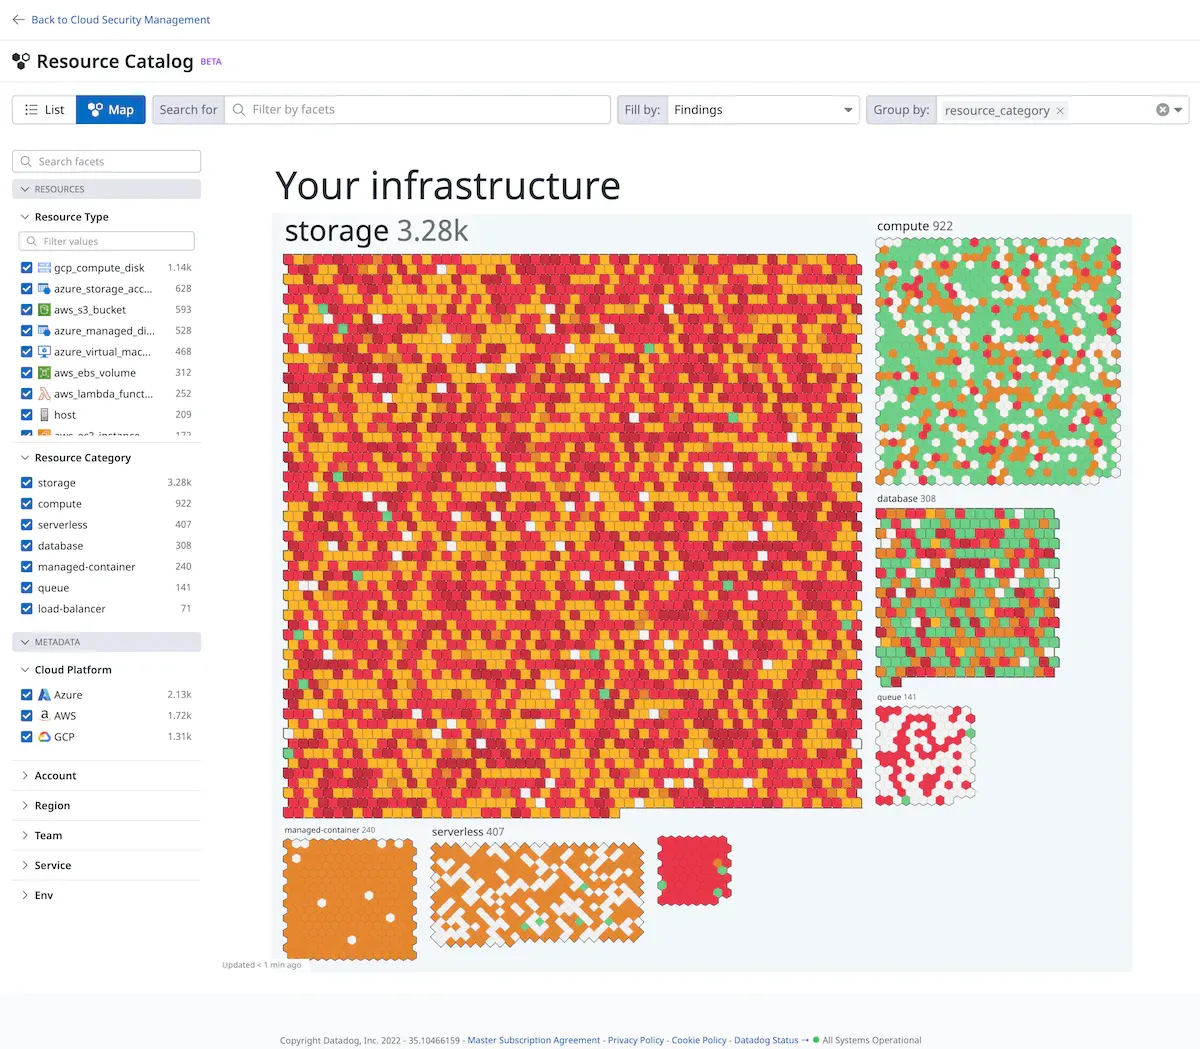
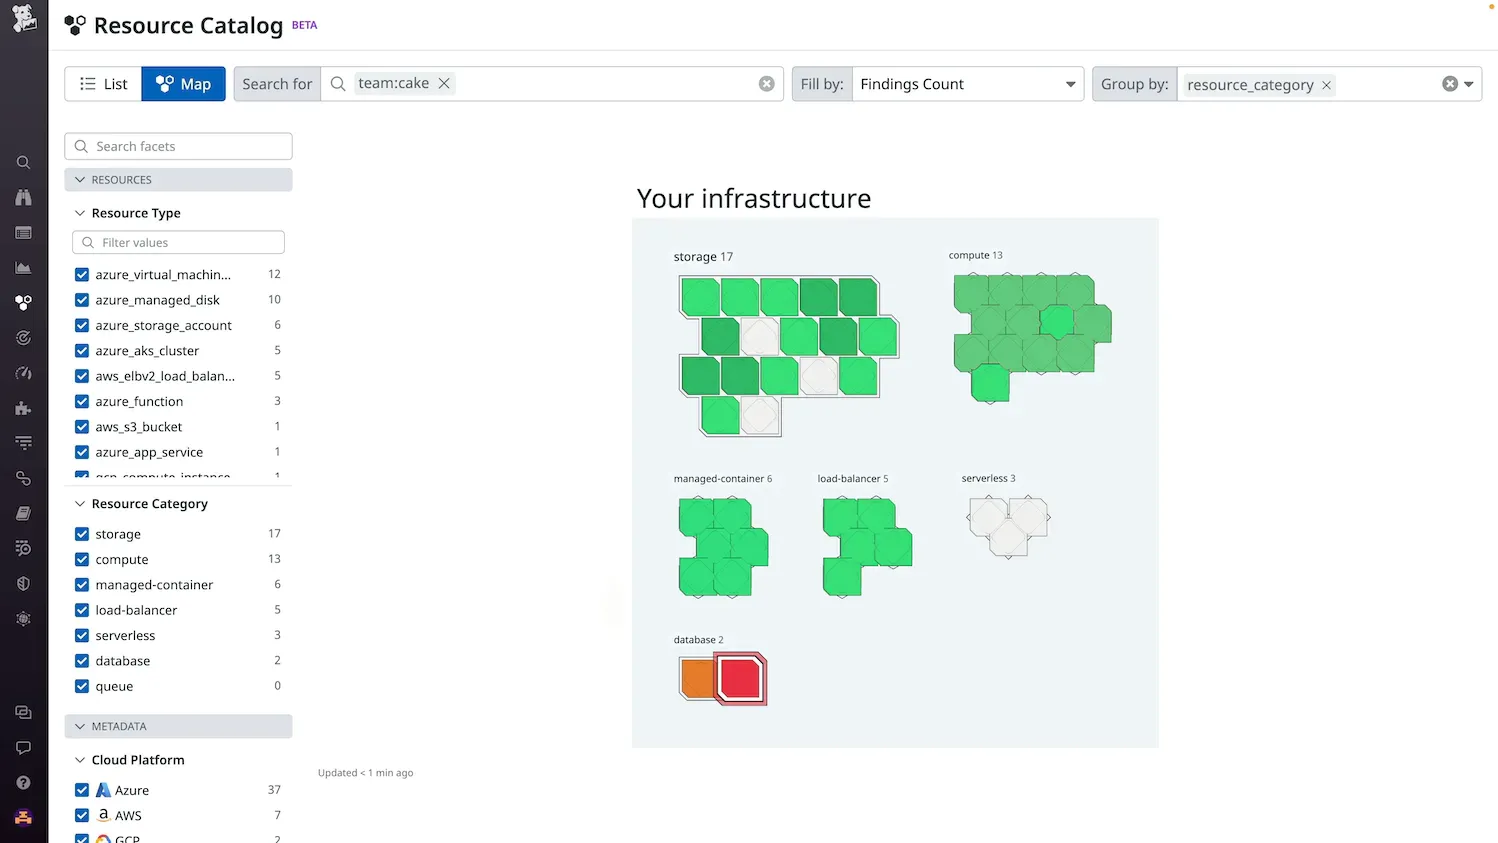
- announced a new Resource Catalog capability in CSM (in beta) for tracking all cloud assets to oversee all security and risk postures
- announced new Workload Security Profiles capabilities in CSM (in private beta) to leverage AI/ML in security to establish baseline profiles for services in order to isolate anomalous behaviors
- announced that their CSPM has now been extended to GCP (in beta)
- announced a number of enhancements to their new Application Security Monitoring product, including one-click remediation to block suspicious IPs, open-source library vulnerability tracking (SCA), and coming real-time native (in-app) protection capabilities (RASP) [no blog posts on this yet, but was featured in the keynote]
- also they recently announced a new security-focused blog in Jul-22 called Security Labs
Core Platform
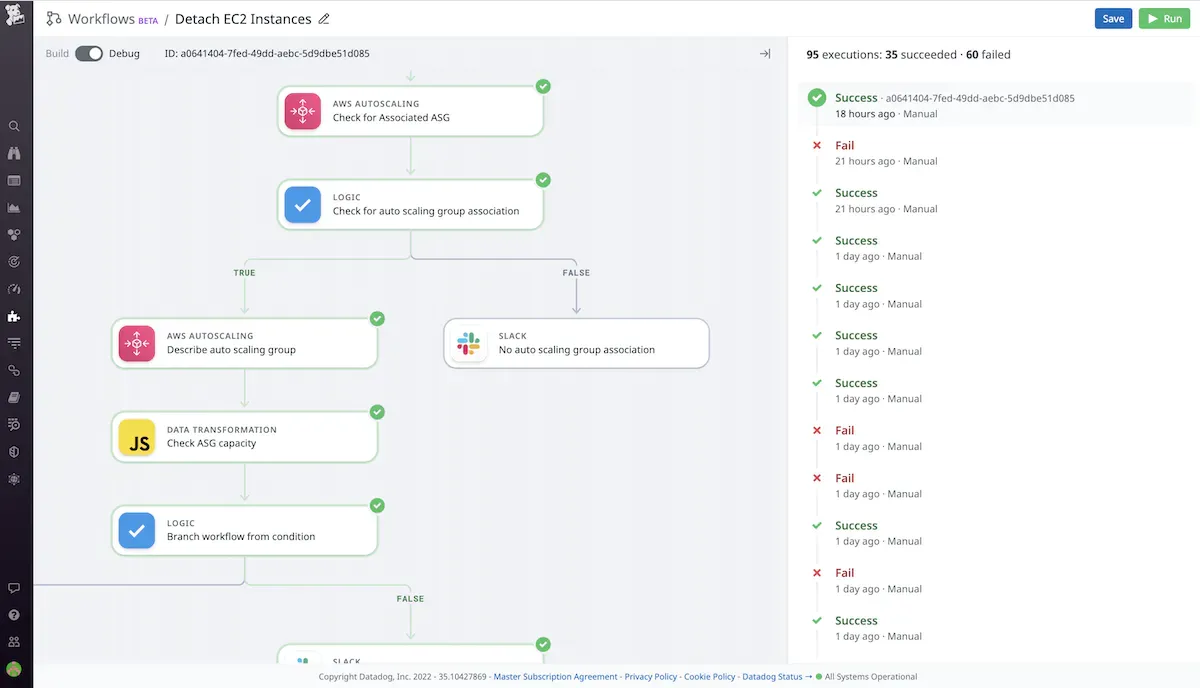
- announced Workflows as a new no-code/low-code orchestration and automation tool (in beta) for running complex app & app stack processes and remediation playbooks across DevOps and Security use cases, with integrations to over 600+ actions over 10+ platforms like AWS, GitHub, Slack, Okta, Jira, Cloudflare, Fastly, PagerDuty, and ServiceNow [similar to a Monday.com or Asana tool for workflow automation, but for app stacks]
- announced a new Events Management capability in their core platform (in private beta), to leverage their AI/ML to automatically interconnect disparate events, alerts, security signals, and tracked incidents across the Datadog stack, in order to prevent investigation silos by unifying them and center team collaboration into a single interface [no blog posts on this yet, but was featured in the keynote]
- announced various enhancements to WatchDog AI/ML, including expanding Alerts (automated anomaly detection) and Insights (automated remediation tips) to more of the platform [no blog posts on this yet, but was featured in the keynote], plus highlighted the new Root Cause & Impact Analysis capabilities (GA in Aug-22)
What I liked the most
Investor day insights
First off, kudos to the IR team at Datadog for dividing up the investor day presentation into 3 well-divided sections, plus for allowing remote questions during all 3 of separate Q&A sessions (and, yay, I got a question answered). I found the investor day presentation and slides to have a lot of insight into how Datadog is moving in all these new directions – what they focus on, and how they build into them.
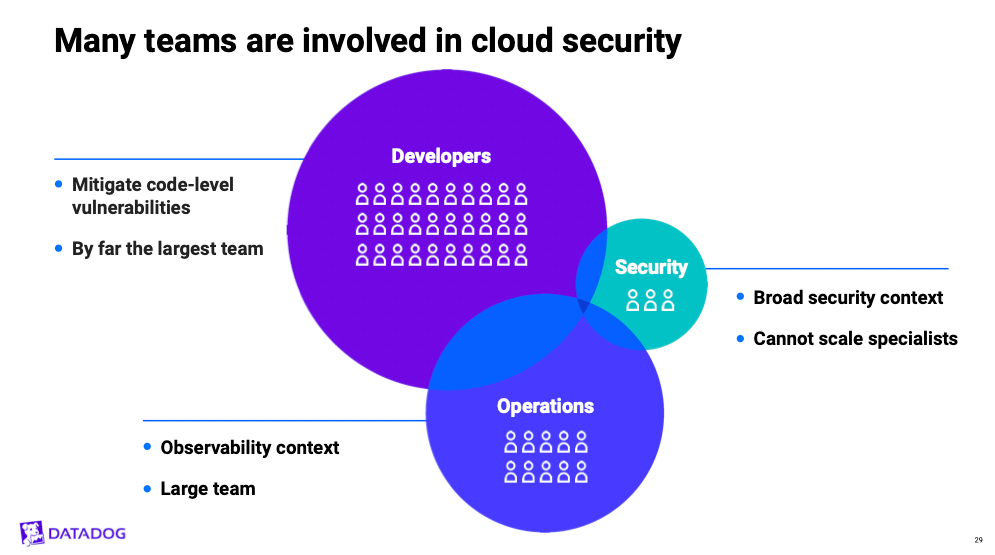
This slide from the Dash investor day presentation shows how they think about their audience (user personas) from the security perspective, but really, the concepts apply to every new product line they are creating that extends into new personas. They continue to focus most heavily on the DevOps (Developers + Operations bubbles) parts, their largest user constituency. In fact, we can see this focus on DevOps across all these new product moves. With Cloud Cost Mgmt, for instance, they focused heavily on how you can tie cloud cost trends into KPIs for DevOps teams to use on their dashboards.
The main focus of their shift into Security is primarily to merge DevOps into the equation, and their shift left moves are to further deepen their platform as a valuable tool that developers utilize all day long. The CEO discussed how they are focusing on their largest set of users (developers) in these moves. With their security products, it is important to think of the security engineers as the stewards of the entire org, while they are overseeing and directing DevOps teams that are the ones handling the day-to-day specifics of finding and patching issues across the apps & app stacks. I think this aligns with how personas are seen in other areas, like how Product Mgmt teams oversee and direct DevOps teams doing the coding and releases. So even though I like to say that Datadog is moving left (developer processes) and right (security), it is important to see these moves through the lens of keeping DevOps teams on the platform, all day every day. These are all fantastic adjacencies, and I am especially excited to see them further leverage AI/ML to bring new capabilities into DevOps workflows, and the new orchestration capabilities to automate tasks across both DevOps and Security workflows.
I also find that Datadog has been quite strong on how it has acquired new capabilities, and mgmt gave a lot of detail on how they think about acquisitions during the investor presentation. The CFO noted how they typically take 12-18mo to fully digest newly acquired products into their platform, to seamlessly integrate all capabilities into the overall platform. (Two exceptions I'll note is that Vector remains a separate open-source product they support, which is the engine that powers their new Observability Pipelines product. Also, CoScreen remains a separate platform, and is just now starting to be integrated, but only into the Incident Mgmt system per the blog post. It seems they intend to keep it a standalone product that is integrated with, contrary to most every other acquisition.)
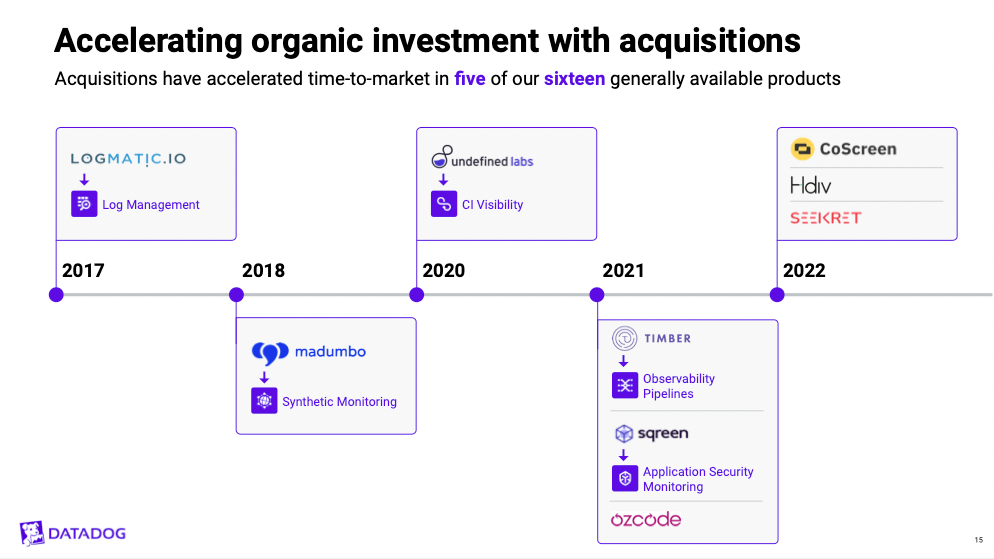
And it's not just for the product capabilities, but also for finding and retaining the talent. Their long-ago acquisition of Logmatic for log mgmt added a leader that is now the SVP of Product Mgmt for logs/APM, while their more recent acquisition of Sqreen for application security provided their now SVP of Product Mgmt for cloud security, who answered Q&A on the security products in the investor presentation.
Expanding o11y
While we didn't see the final release of Universal Service Monitoring (USM) during Dash [it showed up a month later], there was a heavy focus on the new Service Catalog capabilities that debuted in Aug-22, which provides a huge part of what they envisioned with USM. Service Catalog is a service that tracks all the services in use across an organization, and ties in other capabilities like SLO alerts, Watchdog AI, service owner tracking, team notifications, and incident reporting. It is a great example of how well Datadog can seamlessly integrate across all its capabilities into one unified interface, and, in this case, then leverage that as a way to allow for self-service discovery of services used across an organization.
It didn't get much mention outside the keynote, but their new Data Streams Monitoring product looks to be a pretty impressive addition to their APM. It is only in private preview now, but is sure to become a priced product. It is certain to tie into Service Catalog, as it can be used to find issues in producers, subscribers, and queue-handling services, and track upstream causes and downstream impacts.
As another clue of capabilities to come, they discussed a new Event Management system in the keynote that is in private beta. This is the next evolution of their Events system together with Watchdog AI/ML and Incident Mgmt, which ties together disparate events across the products (infra metrics, logs, APM) as an overarching interface that collects and correlates data from events, alerts, Watchdog signals, 3rd party sources via integration, service health, and security posture. It will automatically tie together related alerts, and provide a central interface for incident investigations. In one major hint of what this could become, they called it "AIOps" in their signup link displayed during Dash – which implies a lot more AI-driven automation capabilities are likely coming.
Shifting Left
We first knew Datadog was moving deeper into developer workflows when they acquired Undefined Labs in Aug-20. This turned into a new product called CI Visibility, which first appeared in beta in Jul-21, and went GA at last year's Dash in Oct-21. As expected, the debut of CI Visibility has lead to Datadog moving further into the developer workflow around CI/CD, the tools that control processes across the build, test, and release cycles for app & app stack deployment.
They have introduced several new products on this front as they bury deeper into DevOps workflows. Continuous Testing allows for using Synthetics as a test recorder, allowing DevOps teams to walk through the front-end web app and record the end-to-end actions to take within an application. This recording then is turned into an automated test bed that can be triggered and run within integrated CI/CD pipelines. This leverages a lot of the existing pieces of their APM (RUM and Synthetics) and CI Visibility products and combines them into an easy-to-run no-code test automation platform. This can save DevOps teams a huge amount of "wasted" time they spend writing code for integration tests. I expect this to move into tests over mobile apps on iOS/Android soon, given the new support for mobile apps in RUM last year and in Synthetics just announced.
Beyond that, they are leveraging AI/ML over the CI/CD pipeline now, in what is likely the first of many ways they can improve developer productivity. For now, they introduced the Intelligent Test Runner, which uses AI/ML to isolate what parts of an integration test that a particular section of code impacts. When you make changes to that code, it can just run a subset of the tests relevant to that code change, which greatly reduces the feedback loop that developers have in testing new capabilities during the build stage of CI/CD pipelines. In their example, a complete suite of tests that took 20 minuted to run through was reduced to only take 10 seconds on subsequent code changes. Basically, it has used AI/ML to learn how a request moves across a distributed set of services, and learn the patterns, behaviors, and relationships of the entire app stack. This allows it to then map out what the impacts would be from a code change, and only run tests on those parts of the app instead of every single test every time (as is the norm).
Lastly, they debuted new live debugging capabilities in APM called Dynamic Instrumentation, which allows injecting debugging info into apps built in Python, Java, and .NET, including over 3rd party libraries. This is assuredly from their Ozcode acquisition and its LiveDebugging capabilities [previously covered in premium]. This begins to move them into code-level concerns, and likely ties deeply into their Continuous Profiler and distributed tracing capabilities. While a part of APM, this could easily sit in the "Developer Experience" bucket as well, as this is a very common need in debugging odd behaviors in production app stacks that weren't caught in integration tests.
CNAPP
Datadog is now fully embracing Gartner's CNAPP category, positioning itself with products for cloud-native infrastructure with Cloud Security Mgmt (that they abbreviate as CSM). It's really just a marketing change, better aligning their (until now separate products) CSPM and Cloud Workflow Security more tightly. Mgmt stressed they were remaining focused on cloud-native infrastructure, and so were not interested in moving into networks, endpoint, or older on-prem legacy stacks – which greatly aligns with their overall trends of cloud migration and app modernization.
One big addition in CSM to point out is their new Resource Catalog capability in beta. Similar to the Service Catalog in APM, this provides a complete view of all cloud assets and what their current posture is, and can be subdivided into the resources used by each team. This feels like the start of new Attack Surface Mgmt (ASM) capabilities to come - an area CrowdStrike is going from the XDR side, and Palo Alto has with its Cortex XPANSE.
While they were focused on calling their CSM a CNAPP in the PR, you can also toss in their Application Security Monitoring side (that they abbreviate as ASM ... yes, the same security acronym as just used above for a different purpose) into that umbrella as well. While their CSM covers over app stack and infrastructure, their ASM covers over the app as an agent embedded at the code level – both of which combine into the two sides of CNAPP (cloud infrastructure vs code level) as envisioned by Gartner. After their acquisition of Sqreen in Apr-22, their ASM first went GA in Apr-22. They have since expanded it to now scan apps for open-source libraries utilized in order to track vulnerabilities. This is the first sign of them moving into code-level security, as it has to analyze your application to see and track what 3rd party libraries are being loaded. [This is likely from their acquisition of Hdiv, as previously covered in premium.] Beyond that, during the keynote (and in one vague slide #36 from IR), they mentioned new real-time protection capabilities are coming called "Native Protection" (native meaning in-app), which is likely to be the RASP part of Sqreen that was left out of the initial release. Real-time Application Security Protection, or RASP, is a module that sits inside the application code as an agent that can make real-time security decisions over valid application traffic hitting the service. This is to protect over legitimate-looking traffic that gets through a web app firewall (WAF) but that can still be harmful, such as valid user accounts probing for security weaknesses or trying to inject malicious content in its requests.
The SVP of Cloud Security mentioned they have a lot more to go in CNAPP, including better leveraging AI/ML. One new capability mentioned in CSM was Workload Security Profiles, which uses AI/ML to establish a baseline for each service, in order to do anomaly and outlier detection to isolate security incidents. I expect AI/ML to play a big role in RASP as well for native (in-app) protection.
Cloud Cost Mgmt
This is a new product that was announced at last year's Dash, and is now finally GA. What I like about this is it adds in a new audience (finance teams overseeing cloud costs). But mgmt made clear the main advantage was how they could allow customers to pull in cloud costs as a KPI in DevOps team dashboards. It is ultimately DevOps teams that control what cloud services are utilized, and a big differentiator here is that this helps bring cost controls into their purview. Pricing is per host (AWS EC2 instance), which is a bit odd, given that it tracks more than just EC2 instances (like RDS, DynamoDB, VPC networks, etc).
Automation
Datadog Workflows was introduced as a new no-code/low-code tool for building automated workflow pipelines. This is akin to the types of workflow automation you can do in Monday.com and Asana do for business operations, but is highly honed for DevOps and security use cases. This is not that surprising of an addition, as every SIEM needs a SOAR to take action – but it goes way beyond a SOAR, as they also allow for handling DevOps use cases around app and app stack deployment. This is a whole new tool to handle use cases and automated tasks around the DevOps workflow and CI/CD pipeline, and I expect it to be an incredibly popular addition to their platform.
For instance, if a newly deployed service is showing as having a lot of errors, it can automate rollback to the last stable release. Users can embed branched logic based on data or solicit human input via Slack, and use Javascript for data transformation between stages. There are 600+ actions already supported across AWS, Cloudflare, Fastly, GitHub, Jira, Slack, Okta, PagerDuty, and ServiceNow. This is public beta for now, and it isn't clear if it will be a priced product, but I am guessing it might become a core addition to the platform that improves the stickiness.
The CEO made clear in Q&A that they are focused on "use cases grounded in our data". I expect those use cases to continue into CI/CD pipeline automation – not to replace the CI/CD pipeline but as an orchestration tool to augment it.
Universal Service Monitoring
My guess at Universal Service Monitoring (USM) appearing came true right after Dash, which finally went GA in Nov-22 – more than a year after it was first announced at the prior year's Dash. A blog post detailed how it will auto-detect and monitor all microservices across all of an organization's environments, and seamlessly integrates with Service Map & Service Catalog in APM. This new USM is a priced product that will complement both their Infrastructure Monitoring and APM products.
This extends their existing Service Map feature within APM (app perf monitoring), which visually maps out service interdependencies and traffic in a graph chart interface, along with their ability to analyze intercommunicating services via NPM (network perf monitoring). It uses eBPF technology to have an observability agent running within the Linux kernel, in order to do extremely lightweight monitoring of any processes running on that system. (eBPF has been around for decades, but with the rise of Kubernetes and containers, is having a resurgence, providing a great way to do secure monitoring of containers without impacting the underlying host system.) This is similar to the service that Splunk acquired in Nov-20 from Flowmill, in order to pull NPM metrics from intercommunicating microservices, and that New Relic acquired in Dec-20 from Pixie Labs, later integrated into their platform in Jul-21.
It again continues to push Observability into more DevOps use cases, this time expanding the audience towards SRE (site reliability engineers) use cases. The focus here is around what the SRE industry likes to call "Golden Signals", which are metrics around latency (time it takes to serve a request), traffic (rate of incoming queries), errors (sampling the error rate), and saturation (load the service is experiencing). This product is about tracking these metrics over time, as new versions of a service get deployed. All of these result in trackable SLOs (service level objectives) to monitor an application's performance against business metrics.
This all ties in heavily with the new CI/CD Visibility product line and how APM is now doing deployment tracking of each app service over time. These golden metrics are now tracked alongside each release of an app service, so that SREs can compare the performance of the current version to the past ones, which helps pinpoint when problems are corrected, as well as when new problems emerge (say, a service is now having a higher error rate after the latest deploy, or a that it no longer handles the same amount of traffic). This greatly ties into deployment and test strategies that companies might be doing in their software releases (discussed before), such as canary deploys and A/B testing.
They acquired Seekret in Aug-22, an API observability platform based on eBPF – so clearly USM will be expanding beyond microservices to also cover APIs.
Add'l Reading
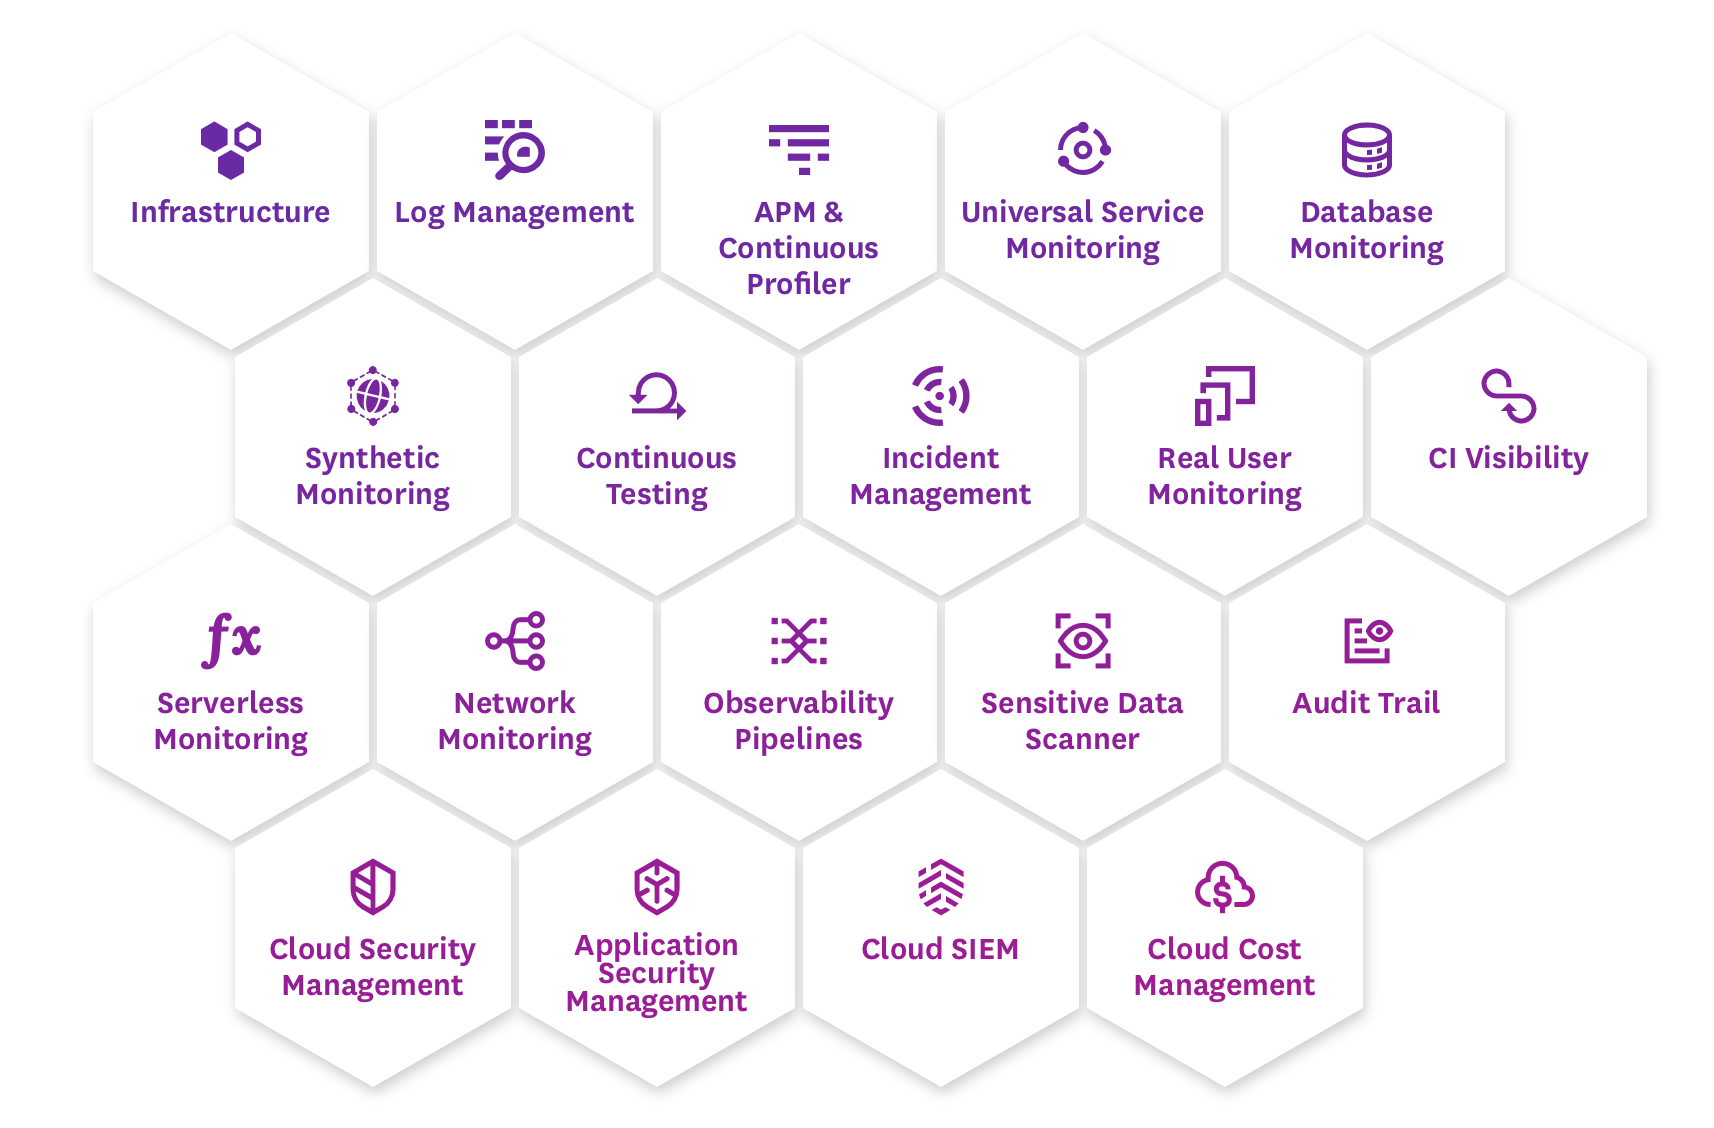
- Peter Offringa of Software Stack Investing also covered the announcements out of Dash. He continues to have an unhealthy obsession with their hex-based pricing page (as seen again and again in his past pieces). Just to beat Peter at it, Datadog now shows 19 priced products in its hexes with USM.
I explore hypergrowth companies within DevOps tools, observability, edge networks, data & analytics, and cybersecurity (Zero Trust, SASE, XDR, CNAPP). This was originally a post from my premium service from June. Sign up for Premium if you want weekly insights into hypergrowth tech companies and where they are going in their platforms and market pivots, as well as access to a private podcast. I currently have in-depth research and heavy coverage over Cloudflare, Snowflake, Datadog, CrowdStrike, SentinelOne, and Zscaler.
- muji